


Oil (WTI) News and Analysis
- Crude prices edged higher in European trade
- China’s central bank trimmed its prime lending rates for the first time in ten months
- But weak oil demand is still meeting plentiful and growing supply

Oil Prices rose a little on Tuesday following an interest rate cut in China, but the modest scale of the monetary action has disappointed the market.
The People’s Bank of China cut its one-year Prime Lending Rate for the first time in ten months, after mounting evidence that the country’s post-Covid fightback is faltering. The LPR sets commercial rates for prime borrowers and that tends to benchmark both commercial and domestic lending, so cutting it is a big deal.
However, the cut was a meager ten basis points and questions are already being asked about this modest intervention. Wall Street lenders have cut their growth forecasts this month, with Goldman Sachs suggesting that recovery appears to have ‘fizzled out.’ It’s now looking for 5.4% growth this year, not 6% as before.
Concerns about demand for energy in the world’s second-largest national economy have seen oil prices under pressure this year even as major producers moved to cut their output. Official data showed Chinese exports fell a considerable 7.5% in May compared to the same month last year.
With many western economies still mired in a nasty combination of inflation and weak growth, ongoing signs of weakness in Chinese demand will continue to weigh on oil prices.
On the supply side, matters aren’t much better, with reports of increased supply coming to market from both Iran and Russia despite Western sanctions. It’s not surprising, then, that oil-price forecasts are being revised. JP Morgan has reportedly dropped its 2023 Brent crude forecast and now sees the international benchmark at $81/barrel this year, down from an initial call of $90.
This market like all others will look to Wednesday and US Federal Reserve Chair Jerome Powell’s Congressional testimony. The Fed has paused its long series of interest-rate hikes but is expected to make more yet unless inflation shows clear signs of loosening its grip. Other major western economies are still firmly in tightening mode, casting more clouds over likely energy demand.
US Crude Oil Technical Analysis
Daily (WTI) Crude Oil Chart
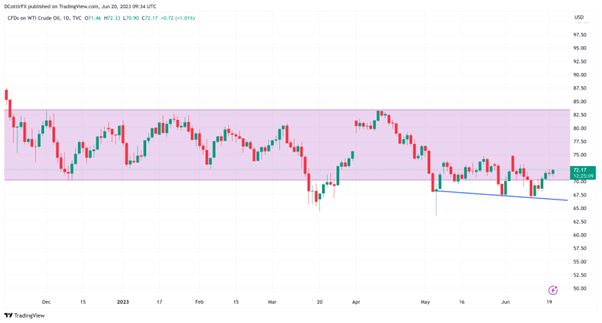
Source: TradingView, produced by David Cottle
Bulls are still quite keen to defend a wide uptrend band from December 9 last year which the market seems to regain in short order every time it falls below the lower bound. However, that task seems to be getting more difficult with the emergence of a newer, daily chart downtrend which looks quite well respected.
Those bulls will need to keep prices above $70.74/barrel if they are to maintain that longer term uptrend band. That level is only a couple of dollars below the current market. The newer downtrend would suggest some chance of a bounce at $66.37 should that first support level give way.
Still, the market is holding above psychological support at $72.00, with June 6’s opening high of $74.68 now barring the way higher. Above that, April’s peak of $83.50 looks safely immune from any near-term test, and it may take a decisive break of that to push the market meaningfully higher.
| Change in | Longs | Shorts | OI |
| Daily | -3% | -12% | -6% |
| Weekly | -5% | -5% | -5% |
IG’s own sentiment data finds the market extremely bullish at current levels with fully 75% of participants taking a net-long position in US crude. These are the sort of extreme indicators which can bring out the contrarian traders, especially given the clouded fundamental outlook.
Trade Smarter - Sign up for the DailyFX Newsletter
Receive timely and compelling market commentary from the DailyFX team
--By David Cottle For DailyFX


