


The British Pound has seen a strong recovery to the end of 2022 as PM Sunak and Chancellor Hunt seem to have restored confidence in the UK with prudent fiscal policy measures. This coincided with some degree of US Dollar weakness and improving global sentiment which has since been dented by growing recessionary fears for 2023. My bias for US Dollar appreciation against the British Pound comes from the economic headwinds facing the UK economy as tighter fiscal and monetary policy could make UK markets unattractive.
Large Current Account Deficit and Recessionary Fears to Weigh on the British Pound
Global yield curve inversion has seen an increase globally strengthening the prospects for a recession in 2023, evidenced by market jitters in December. The US remains in a better economic position with recent data releases hinting that the chances of a recession remain less than those for the UK. As recession fears intensify there is every chance that market participants will likely seek safe havens with the dollar largely benefitting from haven demand in 2022 which should extend into 2023. Taking this into account together with the large current account deficit facing the UK my expectations are for Sterling to face some renewed selling pressure as we head into 2023.
TECHNICAL ANALYSIS
GBP/USD WEEKLY CHART
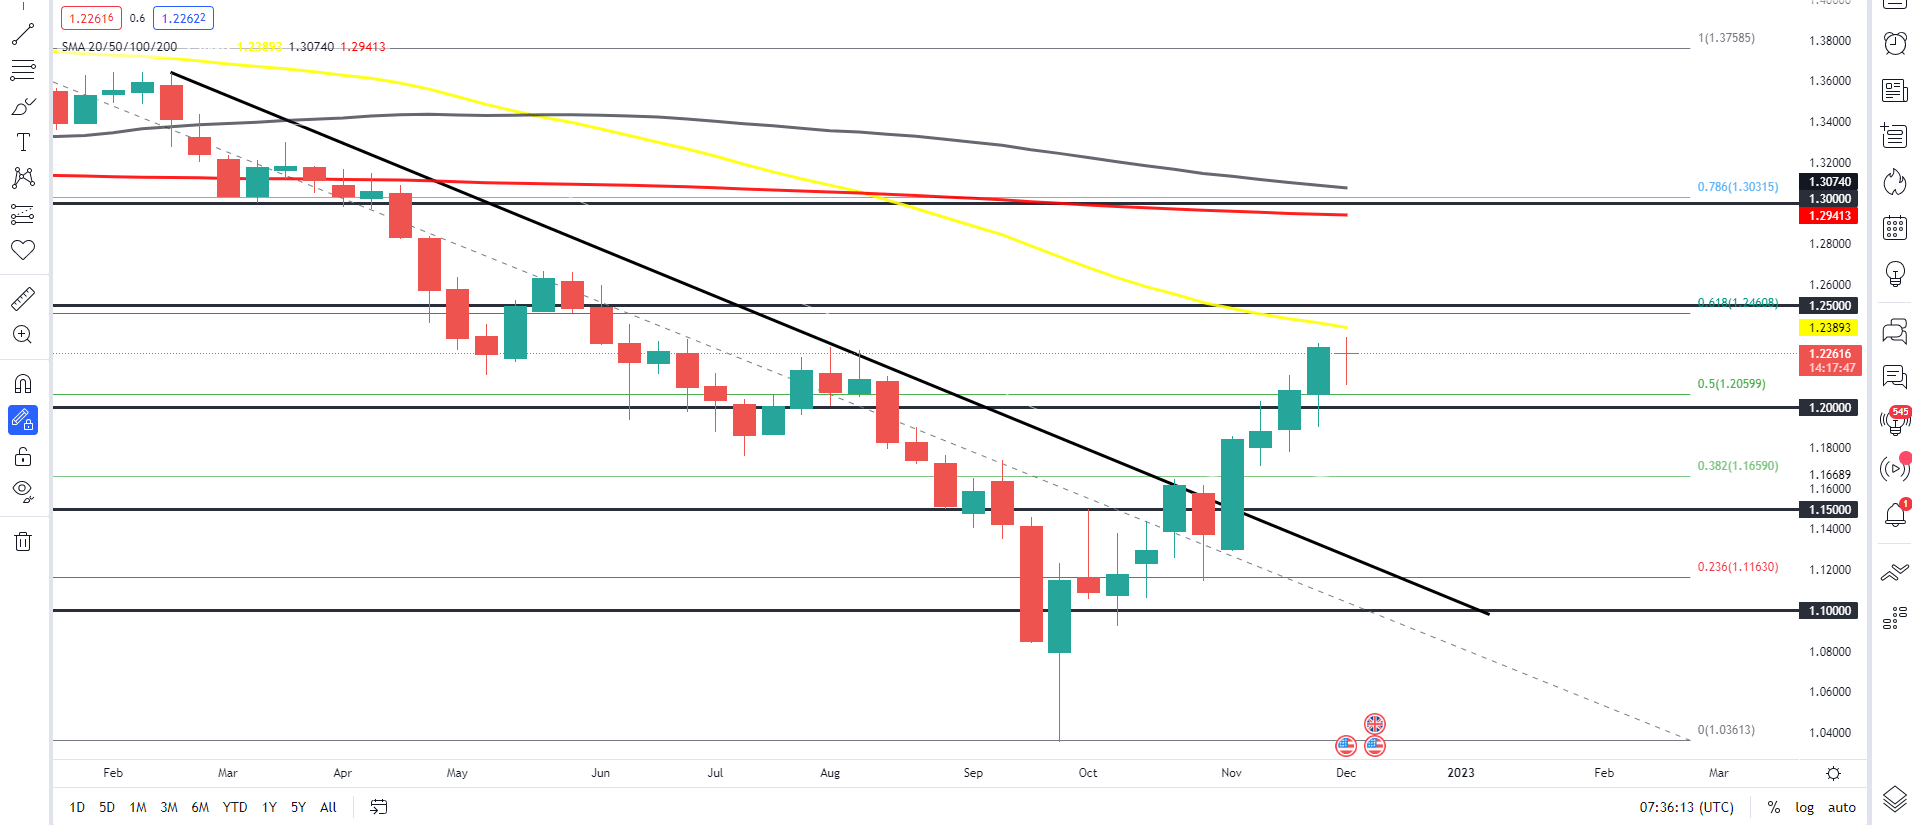
Chart prepared by Zain Vawda, TradingView
From a technical perspective, GBPUSD has seen a break of the descending trendline early in November before rallying 500-odd pips higher. The 50-day MA is currently trading just above the current price with the 61.8% fib level slightly higher likely to provide some resistance as it lines up perfectly with the psychological 1.25000 level. A break higher could see a test of the late May swing high around 1.2640.
GBP/USD DAILY CHART
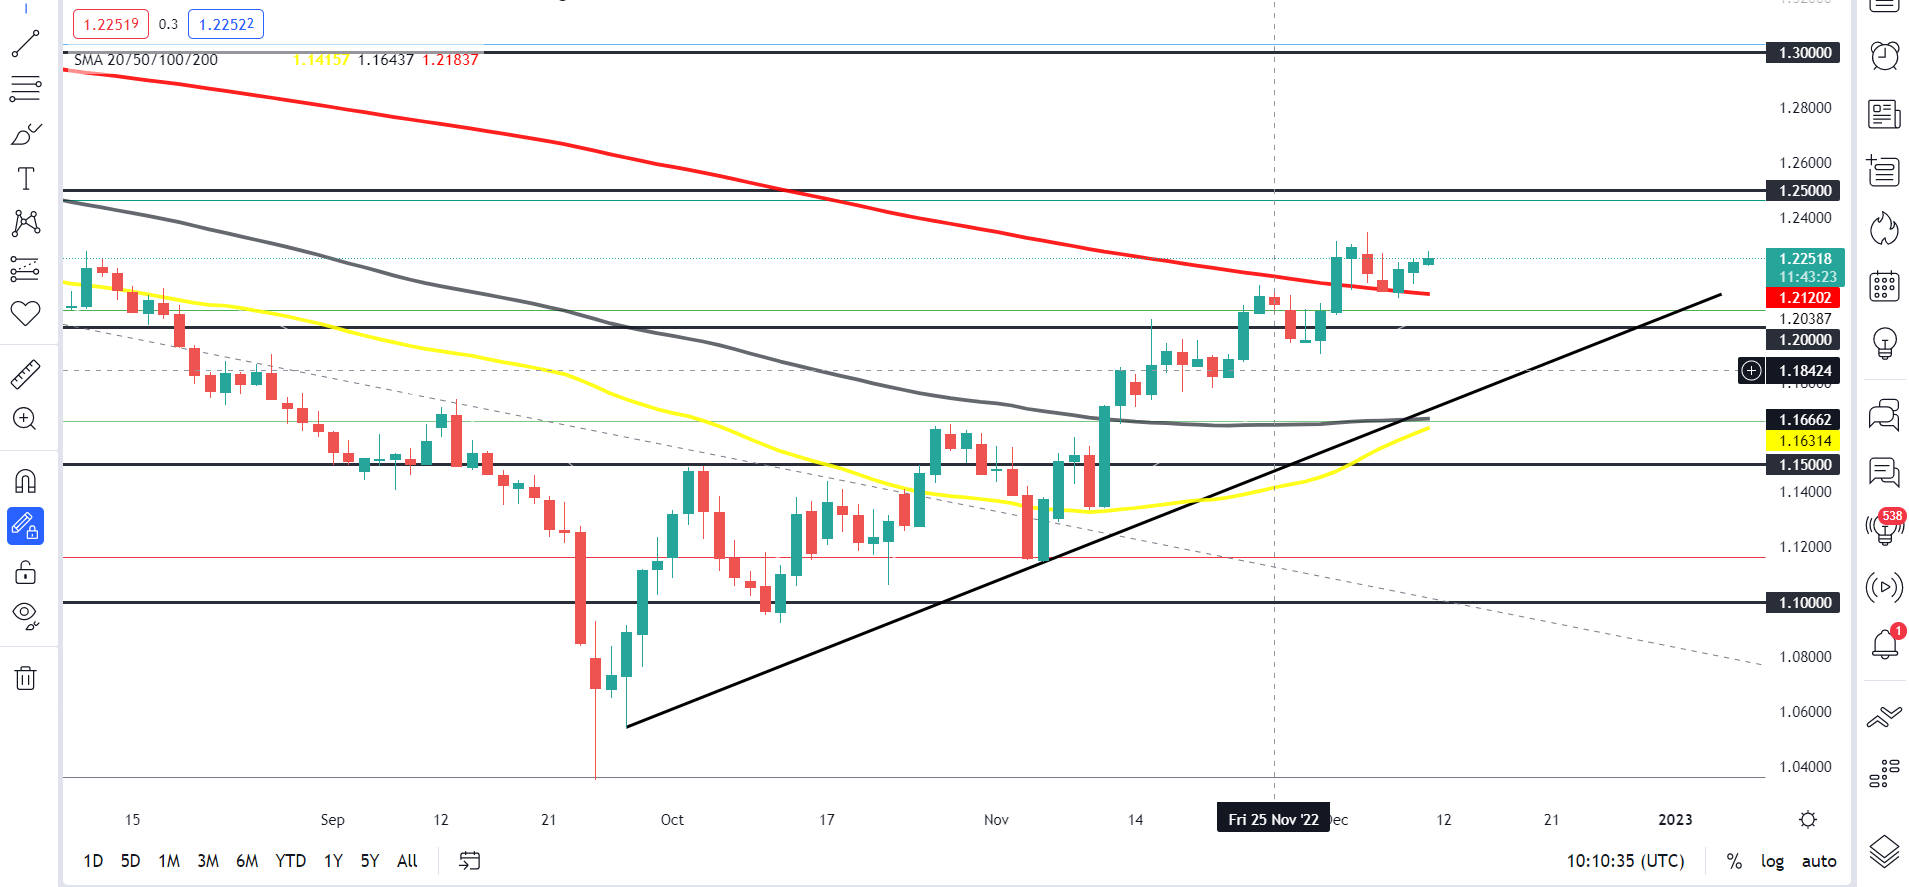
Chart prepared by Zain Vawda, TradingView
On the daily timeframe, we can see the MAs all currently rest below the current price providing support. There is also an ascending trendline in play as we await the potential third touch, which could come into play should the pair find resistance at either the 1.2500 or 1.2640 levels. The gradients on the 50 and 100-day MAs are beginning to tilt to the upside indicating the potential strength of the uptrend.
I think we could see one more push higher before finding some resistance around the 1.25000 area as this would also allow the RSI on the weekly and daily chart to enter overbought territory, adding a further confluence. Any push higher than this will see the 1.2640 (May swing high) level come into play which could provide the best risk-to-reward for potential shorts with potential downside targets provided by the 200-day MA and further down the psychological 1.2000 level.
Contact and follow Zain on Twitter @zvawda


