


The Dow Jones and Nasdaq equity indices have had a decent rally from their October lows but finished down significantly for 2022.
The stimulus measures announced in 2020 in response to the pandemic by governments and central banks globally are unprecedented. The flip side of such economic inducements is the risk of inflation if such measures are left in place for too long.
Once the Federal Reserve acknowledged an inflation problem in February 2022, monetary conditions tightened significantly and continued to do so into the end of the year. The impact of this loosening and then tightening of financial conditions can be illustrated by the chart below. It shows deposits by financial institutions at the Fed.
The initial excess of capital in the system created by ultra-loose fiscal and monetary policies had to find a home. This is where a lot of it ends up and it could be a handy gauge of changes in liquidity within the financial system.
The mapping of the Nasdaq to this indicator shows a fairly strong positive correlation to date. It should be noted though that past performance is not indicative of future results.
LIQUIDITY HELD AT THE FED AGAINST NASDAQ
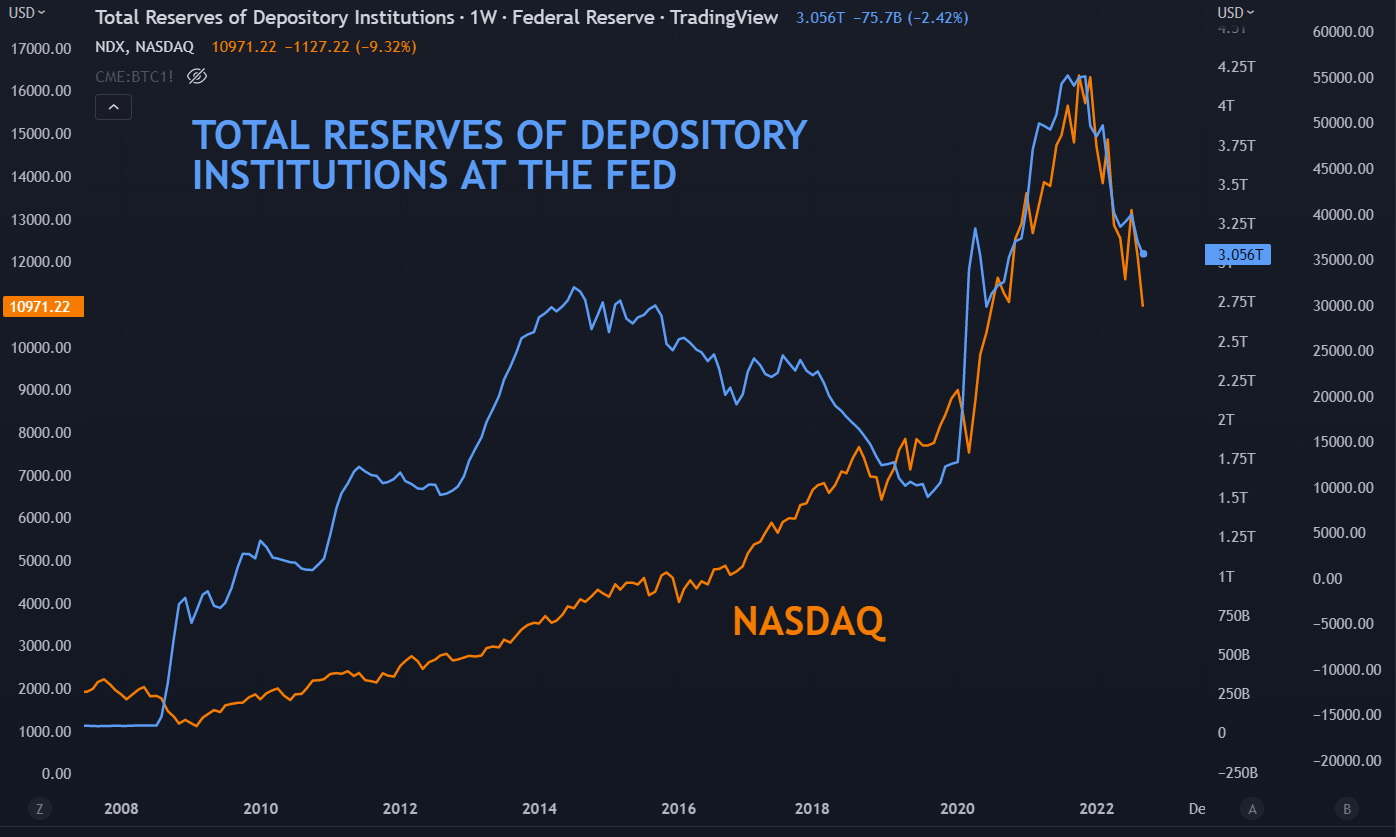
Chart prepared by Dan McCarthy, created with TradingView
The Fed has made it clear that they intend to tighten financial conditions to get inflation under control. It is currently at 7.1% rather than the target of around 2%.
Companies that rely on debt and fresh rounds of capital raising thrived in an environment of excess liquidity. These same companies might find it difficult to borrow and raise equity capital when financial conditions are contracting. A large percentage of technology companies might fall into this category.
Of course, mega-cap tech firms do not have this problem. Seven such companies are in both the Dow Jones and the Nasdaq. The Nasdaq has another 93 companies that have smaller balance sheets.
The Dow Jones has 23 other companies with large balance sheets across health care, financials, industrials, energy, consumer discretionary, materials and communication services. Some of these sectors could be impacted by an economic slowdown, but like their mega-cap tech cousins, they typically have strong balance sheets.
The Nasdaq (NDX) could remain vulnerable to the continuing tightening of financial conditions. The Dow Jones Industrial Average (DJIA) might not be as exposed as the technology-laden Nasdaq.
If this pans out, then trading a long DJIA/short NDX relative value position might best express this view. The ratio of DJIA divided by NDX is at 2.88 at the time of writing this article. During the pandemic, it visited an all-time low of 2.14 in November 2021.
The ratio has already moved up significantly, but it is still a long way below its long-term average of 5.31 (1995-2022). The 3-year average prior to the pandemic is 3.6 (2017-2020).

LONG-TERM DJIA/NDX RATIO
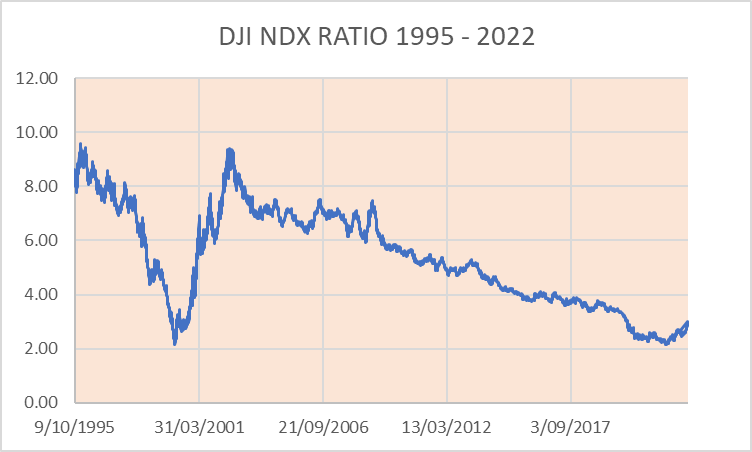
Chart prepared by Dan McCarthy, created using Bloomberg
While the Fed has made it clear that tight monetary conditions are needed for the foreseeable future to rein in inflation, any material change to this outlook will undermine the prospects for this position.
3-YEAR CHART DJIA/NDX RATIO
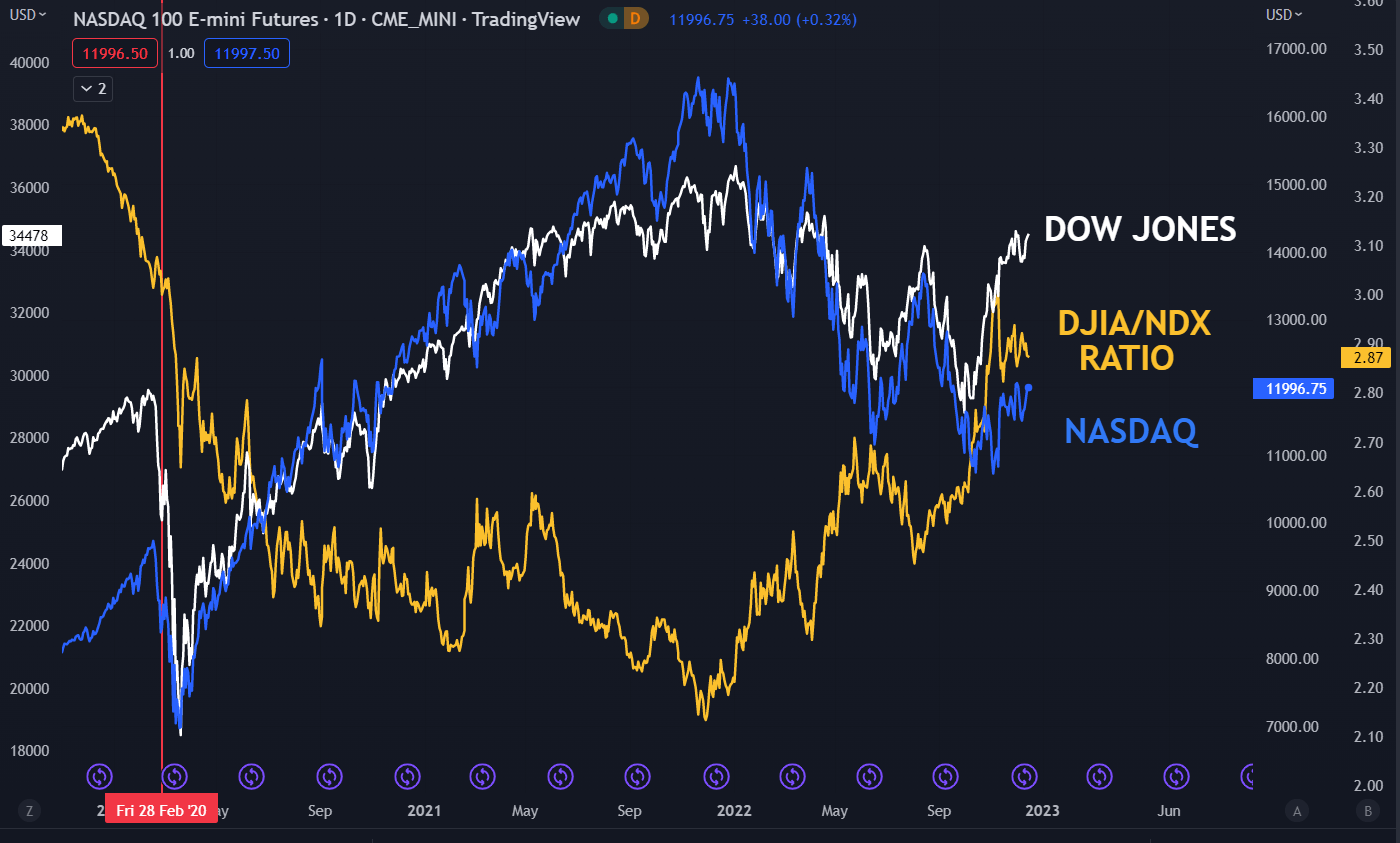
Chart prepared by Dan McCarthy, created with TradingView


