


Indices Talking Points:
- It was a quiet Monday on the economic calendar despite it being Cyber Monday everywhere else, but the latter portion of this week’s docket carries considerable headline risk.
- Chair Powell has a speech on Wednesday afternoon and then Thursday brings PCE data, which is the Fed’s preferred inflation gauge and then Friday brings Non-farm Payrolls for the month of November. Given the Fed’s focus on inflation, this will likely be highly-watched by market participants for clues towards that next move from the FOMC.
- US equities pulled back to open the week but remain within the context of intermediate-term ranges.
- The analysis contained in article relies on price action and chart formations. To learn more about price action or chart patterns, check out our DailyFX Education section.

Stocks pulled back to start the week and if tracking from short-term charts, there were some trends to work with. Taking a step back, however, highlights the ranges that have been in-place for the past couple of weeks that haven’t yet given way. Although with the economic calendar for later this week, there’s likely some positioning ahead of the events taking place as traders tighten up risk ahead of the drivers.
Tomorrow brings Consumer Confidence out of the United States, and then Wednesday brings a speech from Chair Powell. Thursday morning brings PCE data which is the Fed’s preferred inflation gauge and this is followed by Friday’s Non-farm Payrolls data. And given where we are with the Fed’s hiking cycle, with many looking on the horizon in an attempt of finding a slower pace of rate hikes, the intense focus on that data will likely remain.
The big question is whether we’ll hear a balanced message from Chair Powell or something more resembling the Jackson Hole outing, when the Chair was much more focused with a hawkish speech that reminded markets that the Fed wasn’t near complete in addressing inflation.
At this point, inflation remains brisk and far above target; but the Fed has already hiked a lot this year, starting in March, and it will likely take some time for that tightening to fully transmit through the economy. Accordingly, we’ve heard from multiple Fed speakers that have talked up the prospect of slowing rate hikes, which has been music to bulls’ ears. At this point, there’s a scant 32% probability of a 75 basis point hike at the December rate decision, and this has actually been a bullish factor over the past couple of weeks!
S&P 500
The S&P found resistance at the same 4050 level last week, which opens up the possibility of a double top formation. But, for that to come to fruition we’d need to see a breach of the neckline, which currently marks the very bottom of the support zone around the 3915-3928 area on the chart.
With approximately 135 points from the top to the neckline, this would provide a projected move down to below 3800 if it fills in. But, that 3915-3928 area is support until then, and a hold in that area keeps the door open for range continuation scenarios in the S&P 500.
On the resistance side of the coin, this is where the plot thickens. Just above the 4050 high is the 200 day moving average, and just above that is a confluent spot around 4100. And above that is a lot of other possible resistance so the road ahead is not a simple one for bulls, and this is likely playing into the lack of bullish behavior over the 4k psychological level of late.
S&P 500 Daily Chart
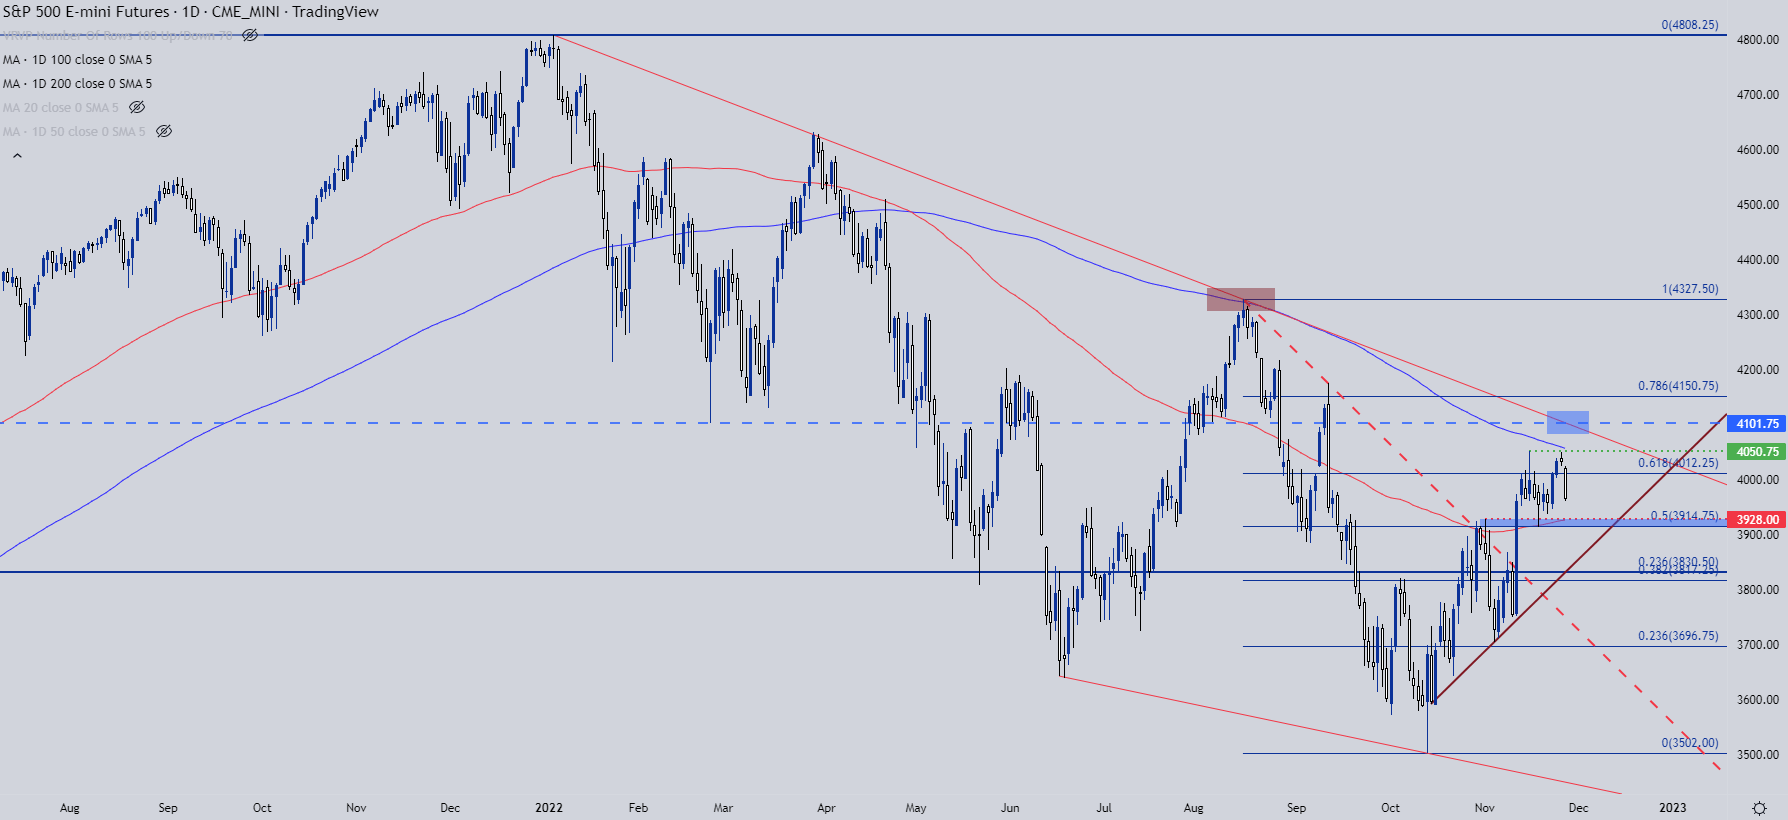
Chart prepared by James Stanley; S&P 500 on Tradingview
Nasdaq 100
If we do see equity weakness themes making their way back by the end of the year, rates are likely going to be a push point, and that would also mean that the Nasdaq could have a greater level of vulnerability. And as a comparison, during the recent rally the tech-heavy index has lagged and even at this point, remains very near the lows while both the S&P and Dow have put in some topside stretch.
While the S&P 500 is holding resistance just below the 200 day moving average, but support above the 100 day moving average – the Nasdaq hasn’t scaled above either yet, further illustrating that lag.
Shorter-term, there’s a possible descending triangle formation in here with support taken from a neckline at around 11,528. The next support below that is a familiar Fibonacci level plotted at 11,294.
If that comes into play tomorrow, there may be an attractive bounce setup provided that support has confirmed at that level. But, if we get the risk aversion theme roaring back similar to what showed after Powell’s speech in August, it’s the 11,068 level that’s of interest as a push below that would mark a return of control to bears.
Nasdaq Daily Price Chart
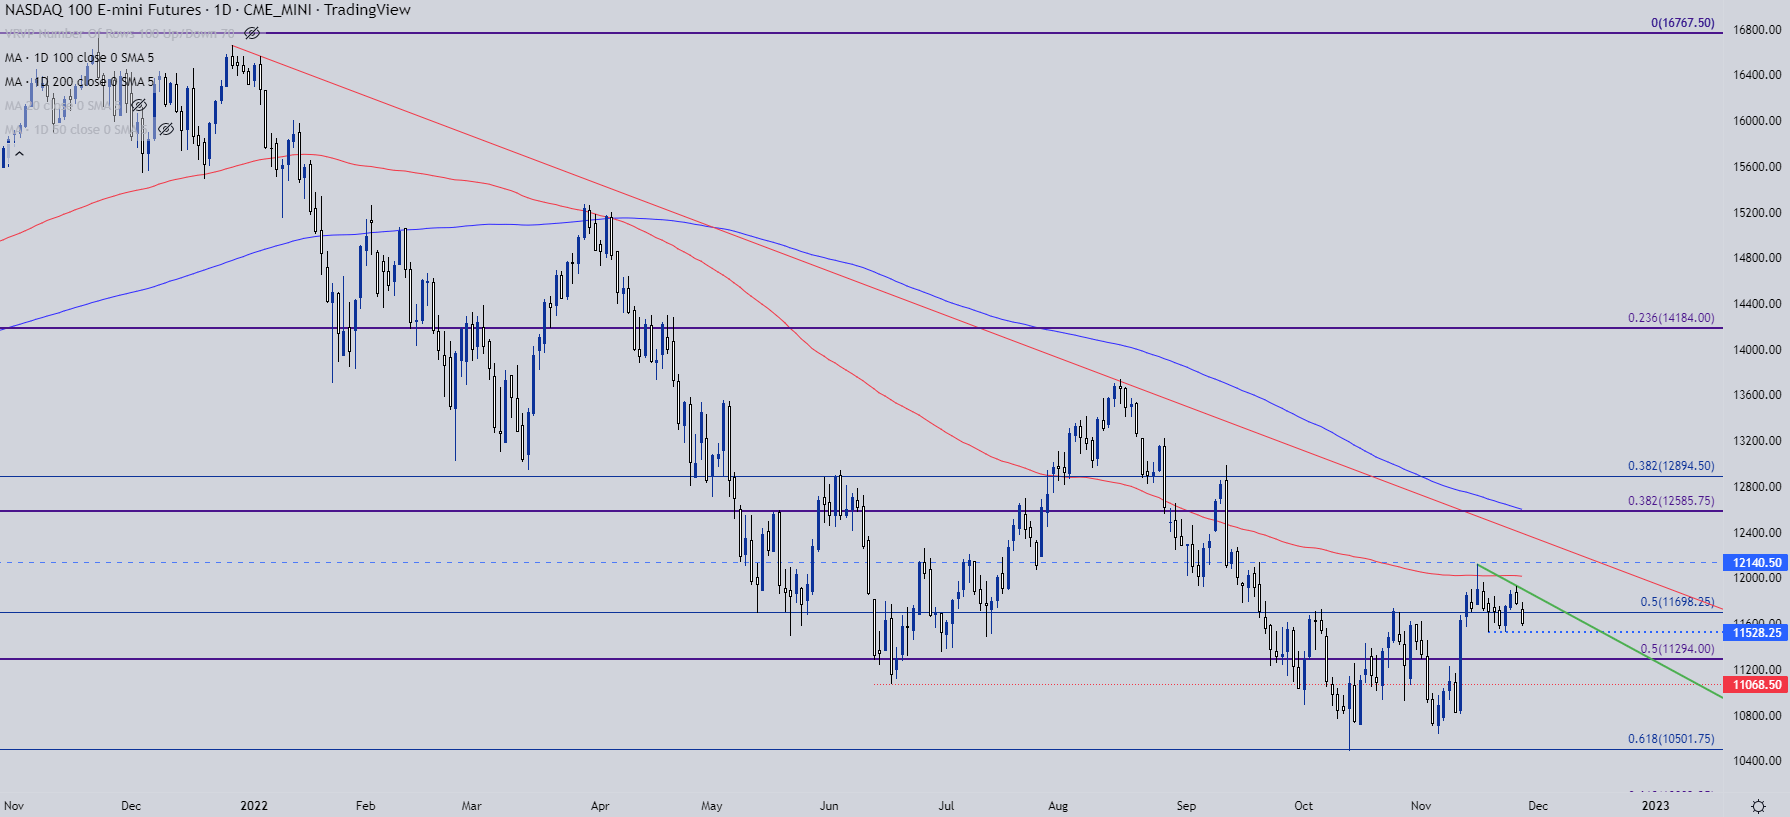
Chart prepared by James Stanley; Nasdaq 100 on Tradingview
Dow Breakout Pulls Back
The Dow has led the way-higher and it’s the only index of the three discussed in this article that has pushed over that prior August high. So it’s set a fresh six-month-high just last Friday, and opened this week with a fast reversal. This brings up a number of now nearby prior support levels. There’s a spot at 33,701 that’s a Fibonacci level of note, and below that is a prior price action resistance swing turned support, plotted at around 33,444.
For bears, they would likely want to see the 33k level traded through; although there may be greener pastures for equity bears elsewhere, such as the Nasdaq setup looked at above.
Dow Jones Daily Price Chart
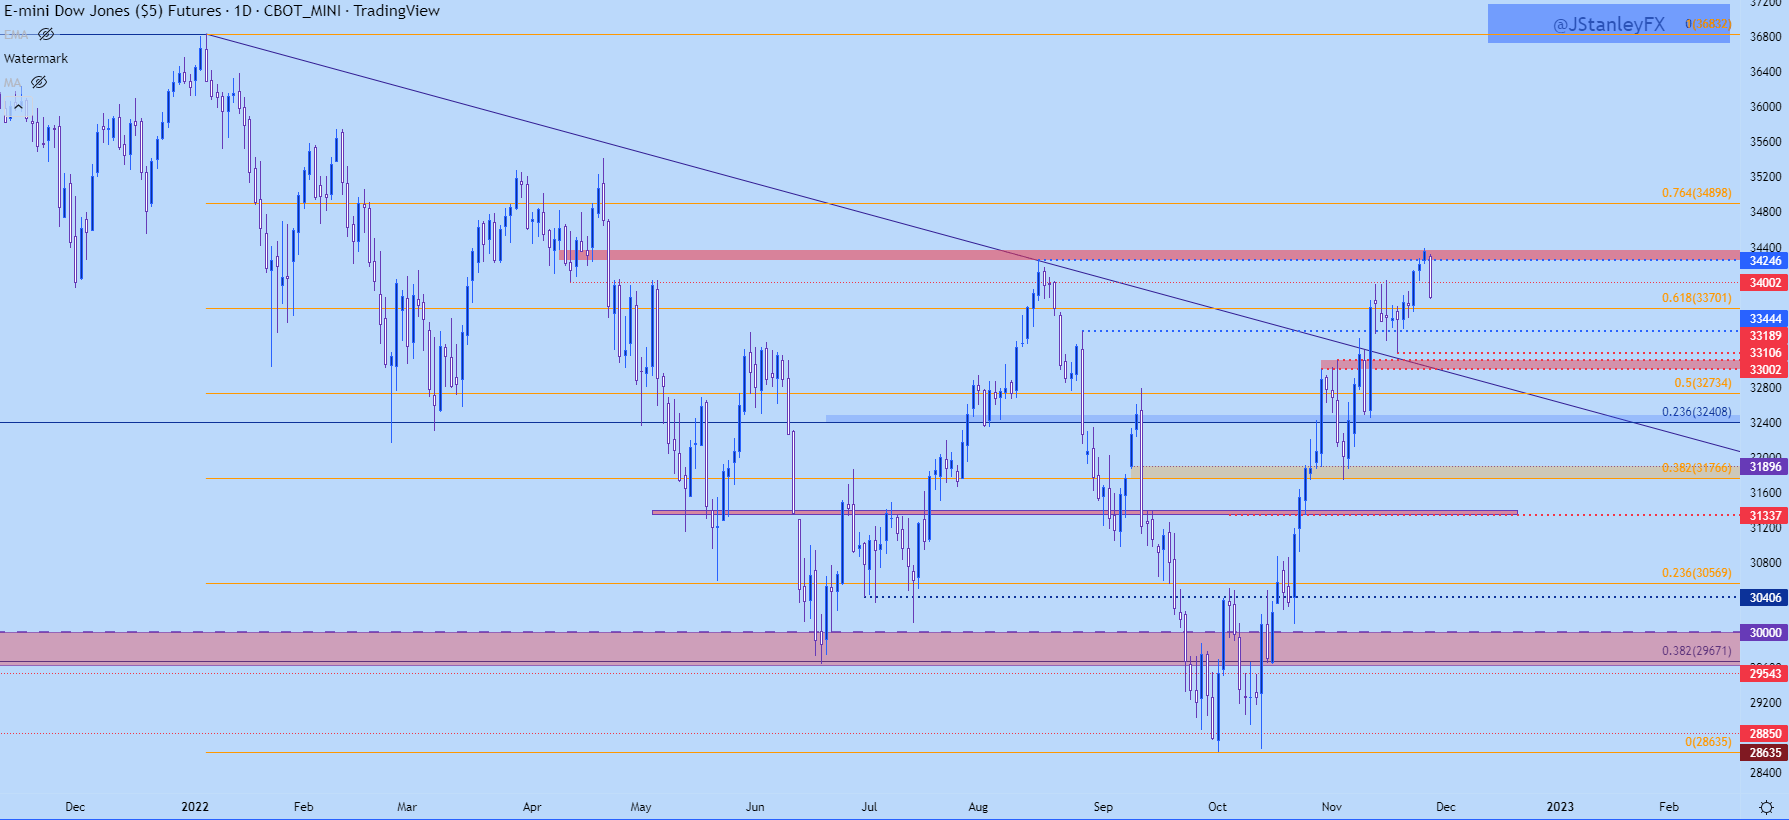
Chart prepared by James Stanley; Dow Jones on Tradingview
--- Written by James Stanley, Senior Strategist, DailyFX.com & Head of DailyFX Education
Contact and follow James on Twitter: @JStanleyFX


