


Indices Talking Points:
- This afternoon brings the FOMC’s final rate decision of 2022, with the wide expectation for a 50 basis point hike. The bigger question is what the FOMC is looking at for next year.
- Yesterday brought a strong intra-day reversal, as US equity prices initially jumped at the CPI release, only to pull back in the remainder of the day, exposing a long upper wick on the daily candles of the S&P 500, Nasdaq and Dow Jones.
- The 2022 low was set on October 13th on the heels of a CPI release, two months to the date ahead of yesterday’s CPI report. The October 13th instance brought an extended underside wick, which led to rally for the next two months. Yesterday’s CPI reaction brought a long upper wick – with the big question as to whether this marks the December high for US equities.
- The analysis contained in article relies on price action and chart formations. To learn more about price action or chart patterns, check out our DailyFX Education section.

Yesterday brought another aggressive reaction to CPI data, somewhat similar to what showed just a couple of months prior. On October 13th, US CPI came out above expectations and stocks initially put in a violent move-lower. The S&P 500 pushed down towards the 3500 level. The Nasdaq hit 10,501, which is the 61.8% Fibonacci retracement of the pandemic move. The Dow, interestingly, held a higher-low above the earlier October print; and then when stocks started to ramp after that CPI release the blue chip index led the way-higher.
Yesterday’s spike saw the Dow get within 5% of the all-time-high that was set in January, marking an incredible recovery move in Q4 trade despite the fact that the Fed is still looking to hike rates and hold tighter policy into 2023.
The big question at this point is by how much and the FOMC will speak to this in the release of the Summary of Economic Projections (SEP). This will contain the dot plot matrix, which is FOMC members’ expectations for rate policy looking ahead. Given some of the possible recessionary signals that have shown along with other fear factors, such as housing numbers, many have started to expect some form of pivot from the FOMC next year.
What that pivot entails is up for question. Some market participants have even started looking for rate cuts next year, under the anticipation that the rate hikes that have already went through will bring about some economic pain that will necessitate looser policy. From most FOMC members’ views, the bank will slow the pace of hikes, starting today, with continued pushes towards tighter policy until inflation is convincingly under control.
Also of consideration for today is seasonality. It’s been a brutal year for equities from a historical standpoint and the S&P 500 just tested above a bullish reversal formation with a couple weeks left in the year. This can keep the door open for a ‘Santa rally’ type of dynamic, particularly if the Fed can avoid freaking market participants out at today’s rate decision.
But, it’s the innuendo that’s important for this afternoon, combined with those expectations for 2023.
S&P 500
Coming into Q4 matters remained very bearish. Stocks were holding near yearly lows after bears got another shot-in-the-arm in August at the Jackson Hole Economic Symposium. After inflation printed higher than expectations on October 13th, the S&P put in a swan dive until support showed just above the 3500 psychological level.
That day brought a strong reversal, highlighting an extended underside wick that shows buyer support jumping into the matter. That bullish push led to the build of a short-term falling wedge, which was breached in November on the release of another CPI report.
Bulls continued that move through the December open but the big question now is whether we’ve seen the opposite scenario appear after the release of yesterday’s CPI report. The mirror image of what happened on October 13th took place yesterday, with sellers showing a brutal reaction to fresh highs around the release of that report. This leaves an exposed upper wick jutting out from the 2022 bearish trendline.
As I had written in this week’s forecast, I was looking for a test above that trendline to be met with a bearish reaction. This can open the door for bearish scenarios but there’s going to need to be follow-through around FOMC, and that may not show immediately as there’s also rate decisions out of Europe and the UK tomorrow morning. But, if this week’s bar holds below yesterday’s swing-high, there could be brewing bearish potential here.
For levels – near-term, 4050 remains as support and below that, it’s the 4k level that looms large. If sellers can push below that, then I’m reverting to the support zone taken from prior resistance, plotted from around 3912-3928. Below that and bears are exhibiting control, which casts next supports down to 3867 and then a confluent zone around 3800. On the upside of price, 4099-4100 remains key, and a break above that opens the door for re-test of 4139. Yesterday’s high is at 4180, and a breach of that negates the bearish theme.

S&P 500 Daily Chart
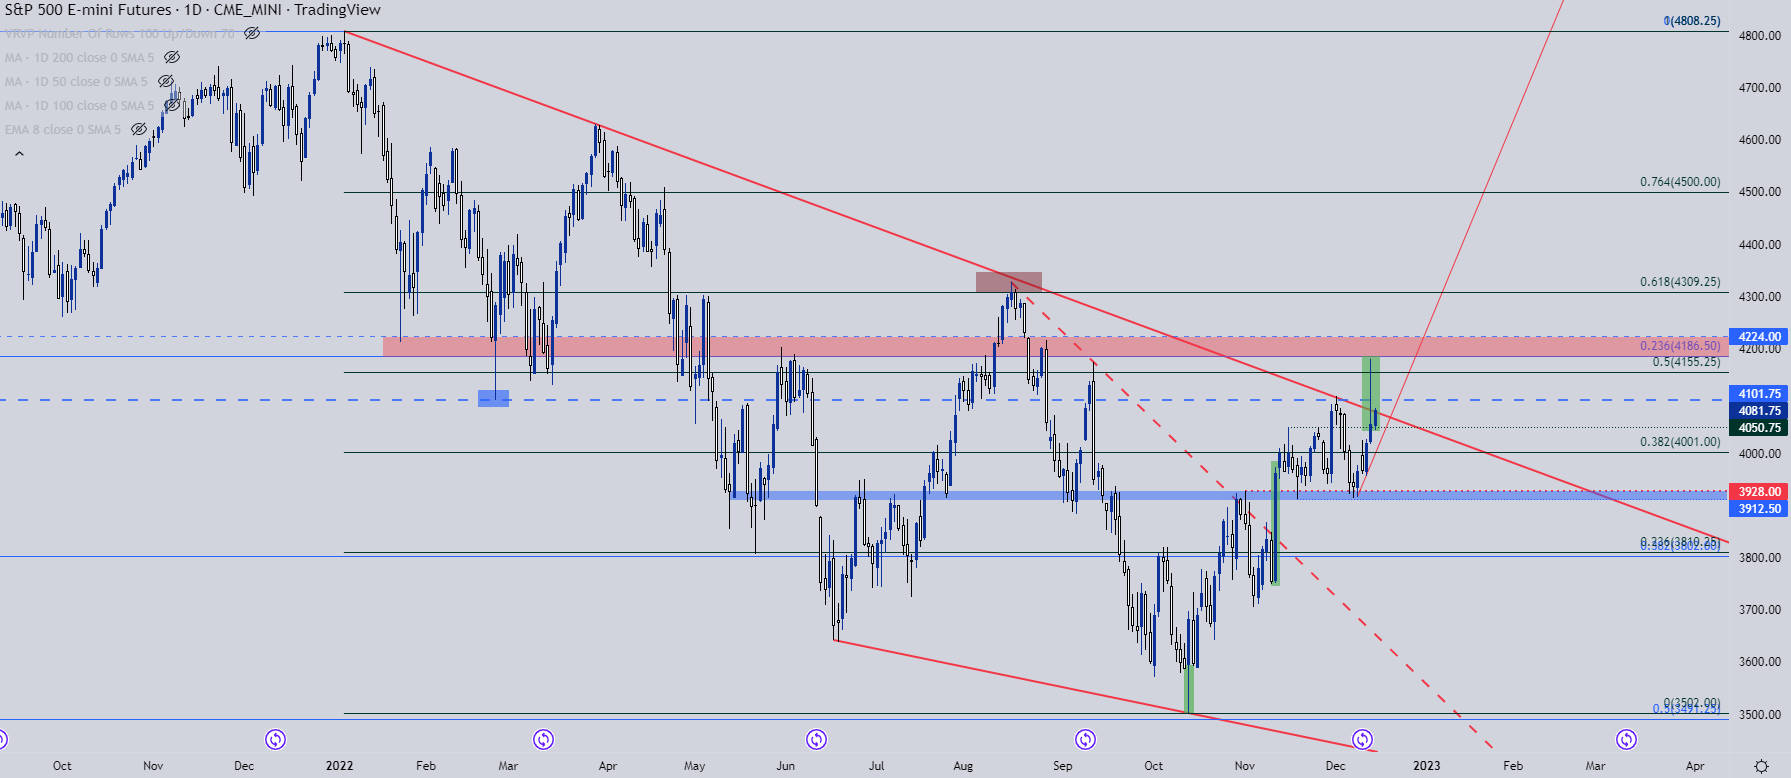
Chart prepared by James Stanley; S&P 500 on Tradingview
Nasdaq
The Dow led the way from the October lows and the Nasdaq was the laggard. And given the impact of higher rates on tech-heavy businesses, this made sense. And if there is another wave of bearish action, the Nasdaq could remain as an attractive vehicle as the higher rate environment will likely be a greater burden on tech-heavy companies.
From the daily chart of the Nasdaq, there’s some horizontal resistance that’s been at-work over the past month, from around the 12k psychological level up to 12,074. That zone has been tested multiple times and yesterday’s high printed well-above that area, indicating that bulls have already softened the area up quite a bit, and it’s no longer attractive for reversal scenarios.
What could be more enticing, however, is if we do get another bullish push, allowing for the 12,585 Fibonacci level to come into play. And if that push can run for long enough, the resistance zone taken from around 13k could remain as appealing.
That’s a scenario that I’d anticipate coming into the picture if today’s FOMC leads to a net bullish response, so that reversal scenario in the Nasdaq may have to wait until 2023 trade, if it comes about.

Nasdaq Daily Chart
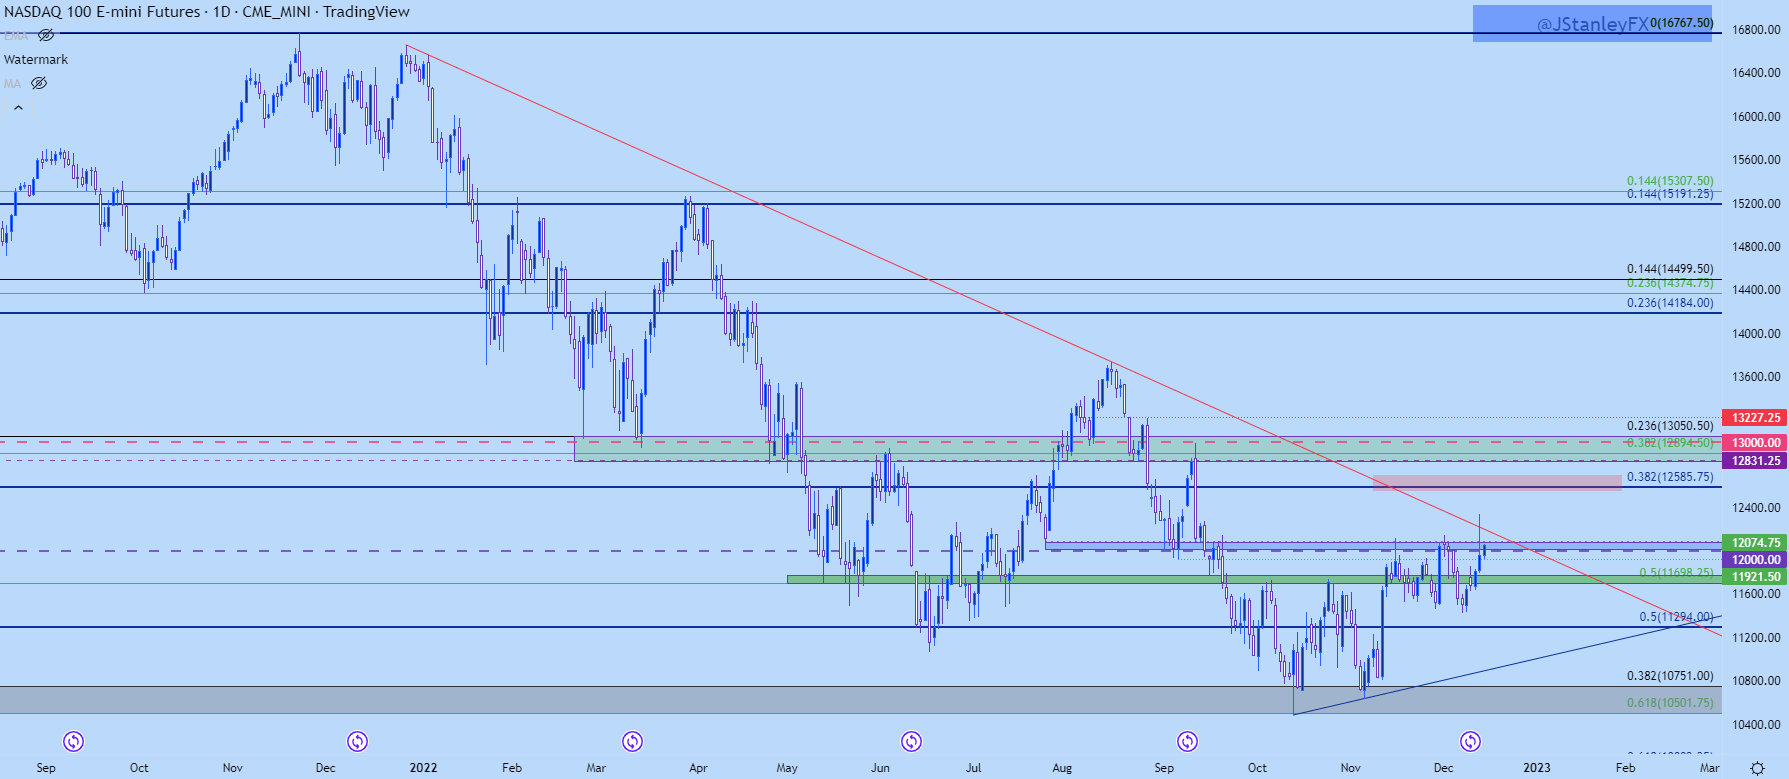
Chart prepared by James Stanley; Nasdaq 100 on Tradingview
Dow Jones
The Dow led the way higher from the October low and yesterday’s spike saw the index get less than 5% from the all-time-high that was set in January. This marks an astounding reversal and at this point the index is down a mere 6% from its all-time-high.
The 35k psychological level appears important here. Bulls were able to penetrate that level briefly yesterday but price fell back to earth very quickly. Support soon showed up at a prior resistance swing, and that’s led to another bullish push back up towards 35k.
This would be a difficult breakout to chase given how developed the move is. A lower-high at or inside of the 35k level could be of interest, however. That would be a bearish look, which, if looking for bearish setups in US equities, may be more attractive elsewhere, such as the Nasdaq.
Dow Daily Price Chart
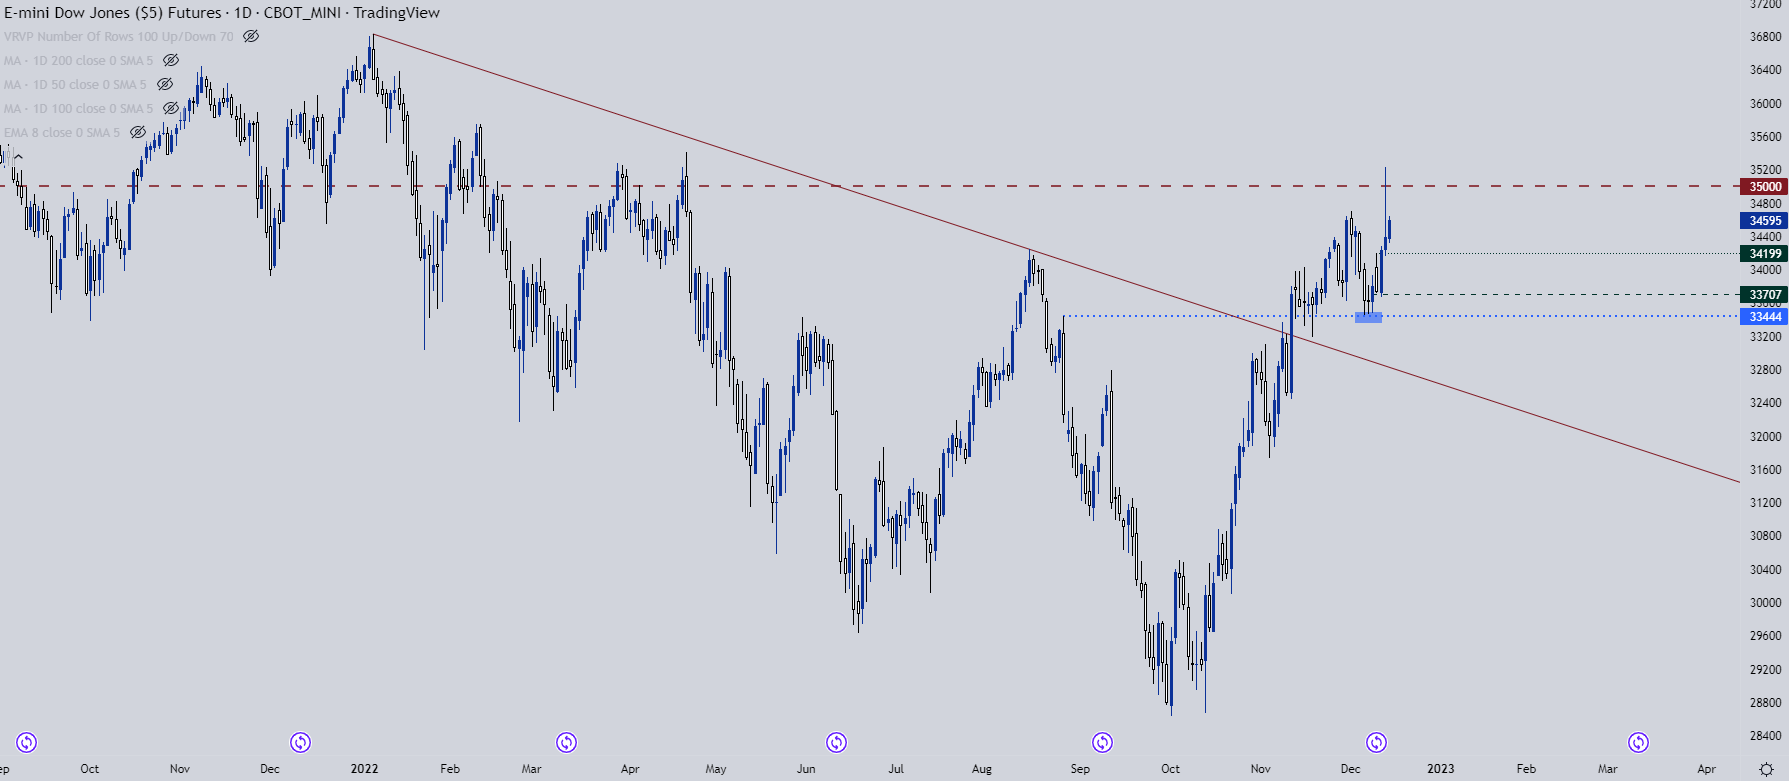
Chart prepared by James Stanley; Dow Jones on Tradingview
--- Written by James Stanley, Senior Strategist, DailyFX.com & Head of DailyFX Education
Contact and follow James on Twitter: @JStanleyFX


