Article by IG Senior Market Analyst Axel Rudolph
FTSE 100, DAX 40, and S&P 500 Prices and Charts
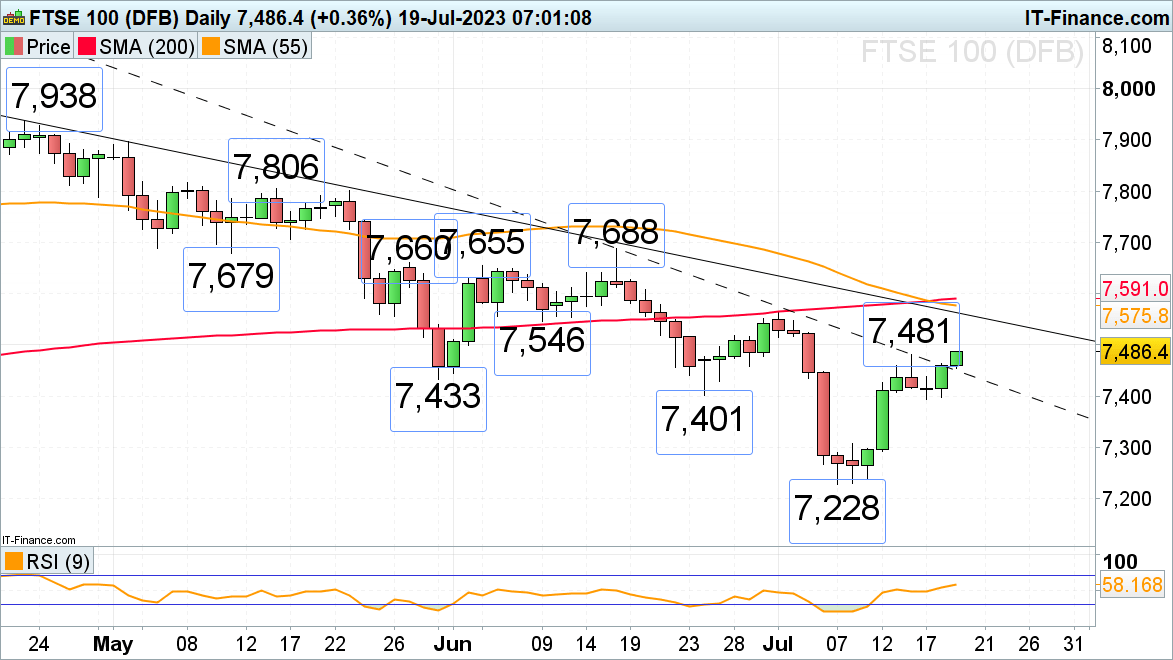
FTSE 100 trades in three-week highs
The FTSE 100 continues to rise as UK inflation comes in slightly weaker-than-expected. UK CPI hit 7.9% year-on-year (YoY) versus an expected 8.2% with core CPI also falling to a better-than-expected 6.9% YoY (vs 7.1%) in June.The index’s rise above last week’s high at 7,481 puts the April-to-July downtrend line, 55- and 200-day simple moving averages (SMA) as well as the early June low and early July high at 7,546 to 7,591 on the cards.
The 7,433 to 7,394 May, June, and this week’s lows are to offer good support. While this area underpins, a bullish reversal should continue to take place.
FTSE 100 Daily Price Chart
Trading Strategies and Risk Management
Becoming a Better Trader
Recommended by IG
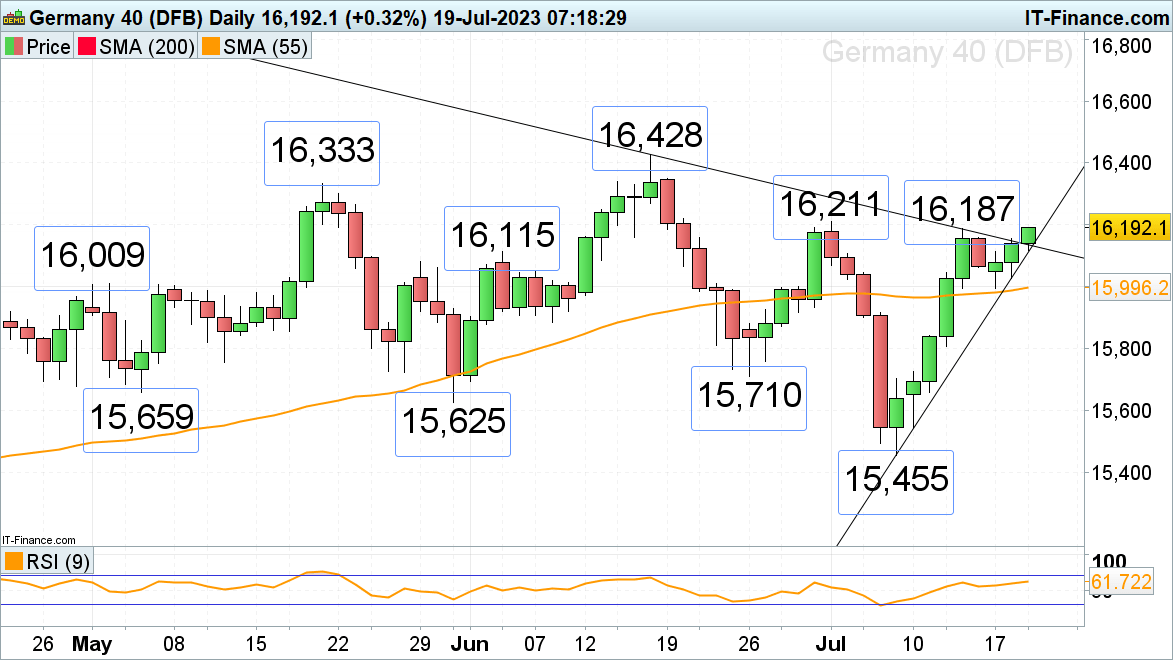
DAX 40 approaches key resistance area
The DAX 40 continues its advance amid better-than-expected U.S. corporate earnings and is on track to probe the early and mid-July highs at 16,187 to 16,221.If overcome, the May peak at 16,333 will be next in line.
Immediate support can be spotted along the July uptrend line at 16,114 and at the 16,009 early May high ahead of the 55-day simple moving average (SMA) and Monday’s low at 15,996 to 15,994.
DAX 40 Daily Price Chart

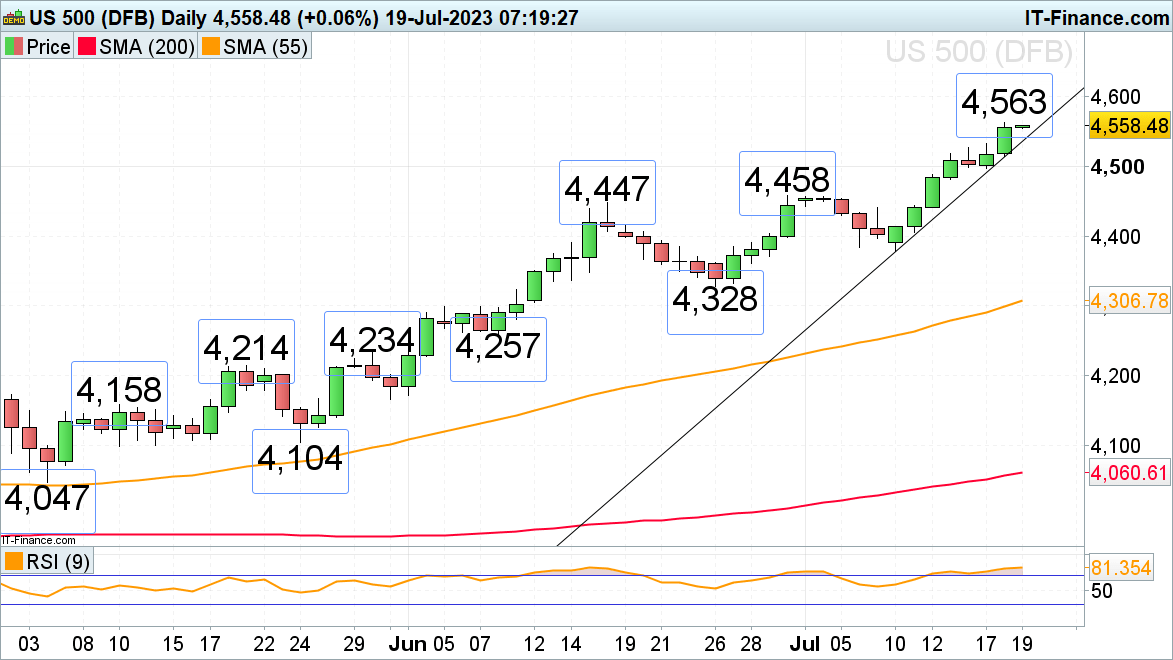
S&P 500 trades in new 16-month highs
Upbeat corporate earnings results and growing expectations for a soft-landing in the U.S. propelled the S&P 500 to new 16-month highs at 4,563 with the late January 2022 high at 4,595 and the March 2022 peak at 4,637 representing the next upside targets.
Slips should find support along the one-month support line at 4,536 and at Monday’s 4,533 high as well as around the 4,530 late December 2021 low. While Monday’s low at 4,498 underpins, the immediate uptrend will remain intact.
S&P 500 Daily Price Chart