


S&P 500 Analysis
- Is bad news good news again? Sentiment appears to have shifted
- A dovish perception of the recent FOMC meeting buoyed risk assets as rate cuts shift closer
- Longer-term trend may be at risk but a number of key technical levels appear in the interim
- The analysis in this article makes use of chart patterns and key support and resistance levels. For more information visit our comprehensive education library

Is Good News Bad News Again? Sentiment Has Shifted
U.S. equity markets have surged in the last week on the back of market expectations which suggests the Fed has reached a peak in US interest rates. While the Fed did not explicitly state as much, this was the perception after last week’s FOMC meeting where the committee acknowledged strong economic performance in the U.S. and at the same time highlighted elevated US yields for its role in further tightening the already restrictive financial conditions.
Markets selectively looked past recent hot economic data and how that may impact inflation and chose to focus on the role played by elevated U.S. yields. This was largely seen as a sign from the Fed that additional interest rate hikes appear highly unlikely, resulting in the bond market reducing the chances of another hike and bringing forward the date of the potential first rate cut in 2024.
This brings about an interesting dynamic as far as market sentiment is concerned as the Fed has been calling for a period of below trend growth and softer jobs data for some time now. The recent softening of U.S. data has propelled risk assets higher, advancing the logic that if the US is to experience further data deterioration, we could see further equity gains. Enter the ‘bad news is good news’ scenario.
Looking at market sentiment via the CNN fear and greed index there has been a move towards neutral but as it stands the indicator still holds on to the ‘fear’ tag.
CNN Fear and Greed Index
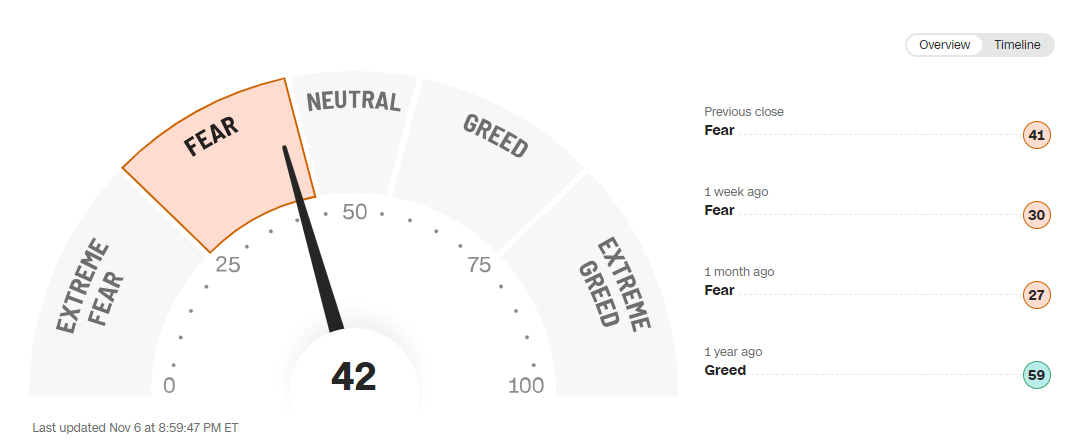
Source: TradingView, prepared by Richard Snow
The daily chart reveals a doji candle yesterday which itself followed on from a daily candle exhibiting a longer upper wick - suggesting a cooling of bullish momentum. in the absence of a concerted pushback from Fed officials, the index could very well continue to rise and test the recent swing high around 4387, with the next level of interest that 4450. There is also a notable drop off regarding high importance economic data this week, meaning there could be little resistance to the recent upward momentum.
Typically such a bullish move would be viewed as a pullback within the longer term downward trend, however, a potential shift in market sentiment could invalidate the current downward trend particularly if we start to see higher highs and higher lows from here on out. The red rectangles symbolize a decline of roughly 6% where we had previously witnessed a tendency for the S&P 500 to produce a counter trend move. Support resides at 4325.
S&P 500 Daily Chart
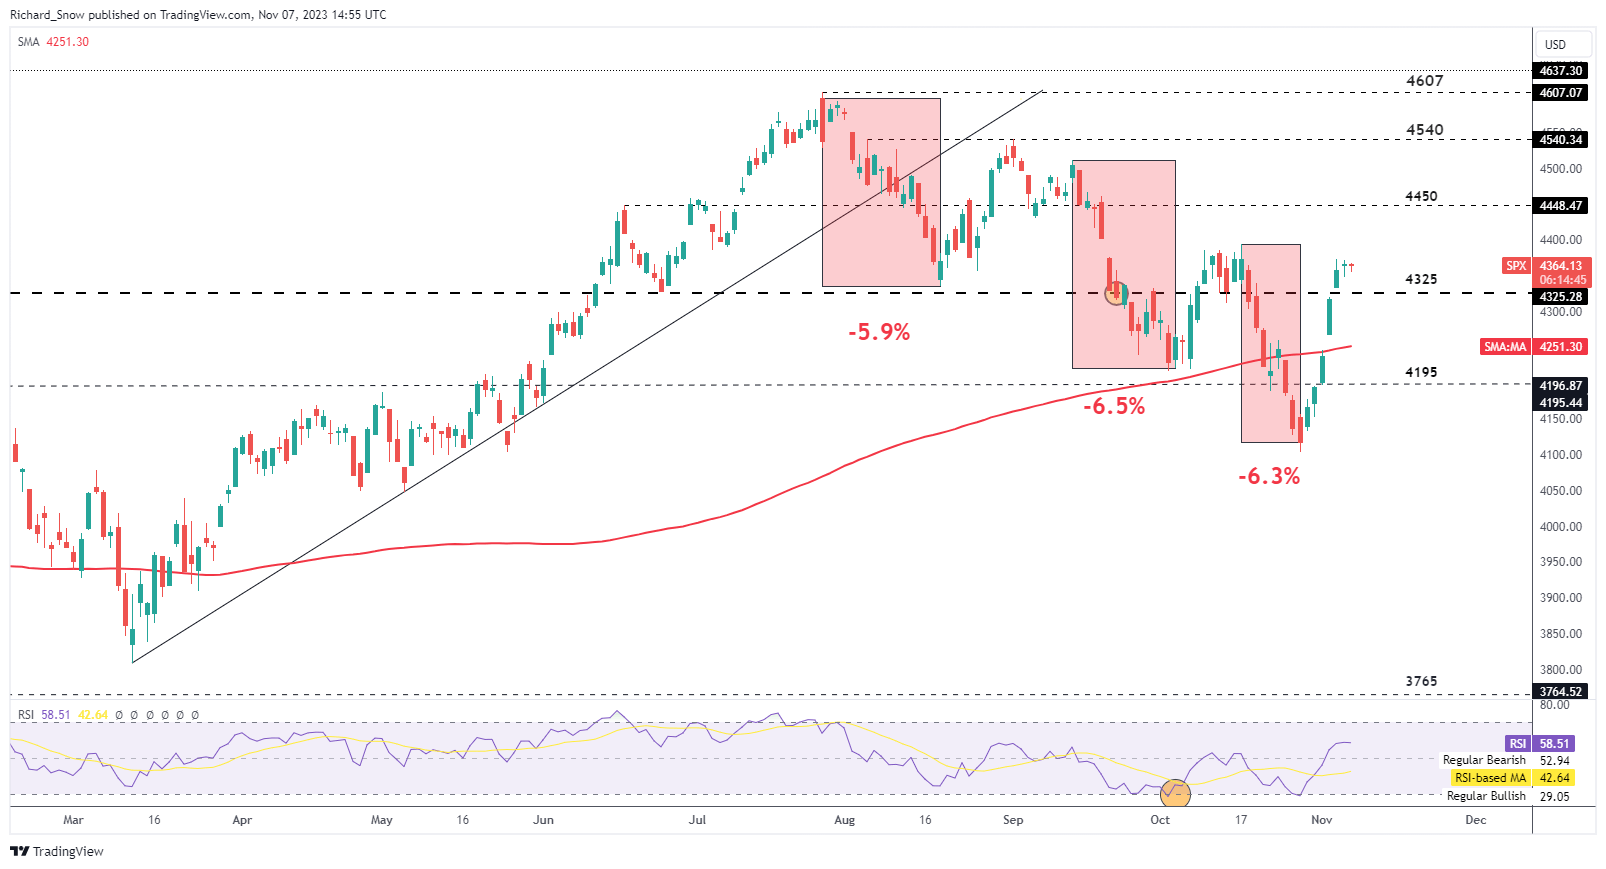
Source: TradingView, prepared by Richard Snow
| Change in | Longs | Shorts | OI |
| Daily | -2% | -4% | -3% |
| Weekly | -10% | 14% | 4% |
The weekly chart puts the move into perspective as this is the largest move to the upside since November 2022. In addition, a key level of resistance at 4325 has been breached - the level has previously acted as a level of support, now resistance.
S&P 500 Weekly Chart
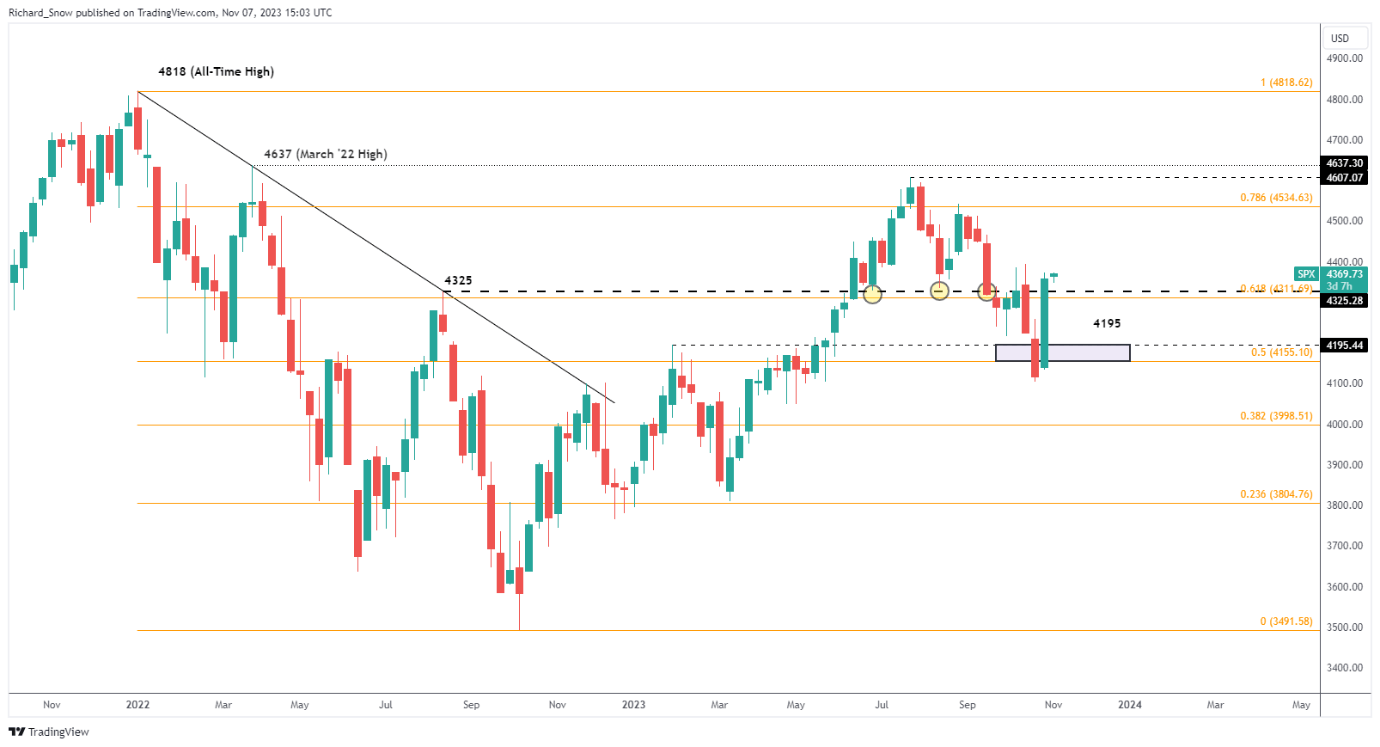
Source: TradingView, prepared by Richard Snow
--- Written by Richard Snow for DailyFX.com
Contact and follow Richard on Twitter: @RichardSnowFX


