


Indices Talking Points:
- Stocks staged an impressive rally yesterday as Treasury Yields dipped and the Dollar pulled back after the emergency move from the Bank of England.
- The bigger question is whether that move from the BoE may lead in to similar moves from the Fed or ECB, and that seems unlikely given the circumstances.
- Tomorrow marks the end of Q3 and there’s an early morning release of PCE data out of the US, which is the Fed’s preferred inflation gauge. This could make for a messy close to the week with those two combined factors.
- The analysis contained in article relies on price action and chart formations. To learn more about price action or chart patterns, check out our DailyFX Education section.

It was a strong one-day rally but, as it stands, it was just a one-day rally at this point. And, if anything, I think yesterday just exposes how stretched so many markets are as the world has a good idea of what’s coming. The Fed has been clear, and so has the ECB. The Bank of England had been rather clear, too, all the way into last week, at least. They know that inflation is rising in a troubling manner and they have little choice but to try to stem it. So hurried rate hikes are the name of the game as global central banks try to get on top of inflation before inflation spirals to more-uncontrollable levels.
With global debt levels where they are a number of problems become exacerbated, key of which is flexibility at the central bank as higher rates equal a significantly higher cost of debt service at a time when few countries can afford such. And, as we saw yesterday, rising bond yields means principal losses for bond holders, such as pension funds and that loss of capital on the back of rising rates can create dislocations elsewhere.
To be sure, this is a pronounced problem and it’s been blatantly obvious for some time. It’s only now started to carry repercussion as initial tightening efforts have done little to stem inflation, hence the recent hastening in policy action as central banks try to play catch up in effort of disallowing the problem from getting out of hand.
Yesterday’s reaction across markets – to an emergency action from the Bank of England – is exactly the reason that the Fed will remain hawkish until inflation comes down. Rallies of that nature are clear examples of the excess capital reserves in the financial system that drive inflation, and Paul Volcker’s aim in the early 80’s was to reduce excess capital reserves via higher rates, which would attract that capital.
But, it appears as though we’re seeing the buy-the-dip crowd quieting, as there’ve been two possible bullish scenarios in the S&P 500 this week that have both been quickly reversed. Tuesday morning showed an ascending triangle formation and a double bottom – both of which triggered into false breakouts and price ran down to a fresh low yesterday morning.
And then after yesterday’s rally, price was holding support at prior resistance from a falling wedge formation ahead of this morning, and that was soundly taken-out with sellers pushing down to a fresh near-term lower-low.
S&P 500 Two Hour Price Chart
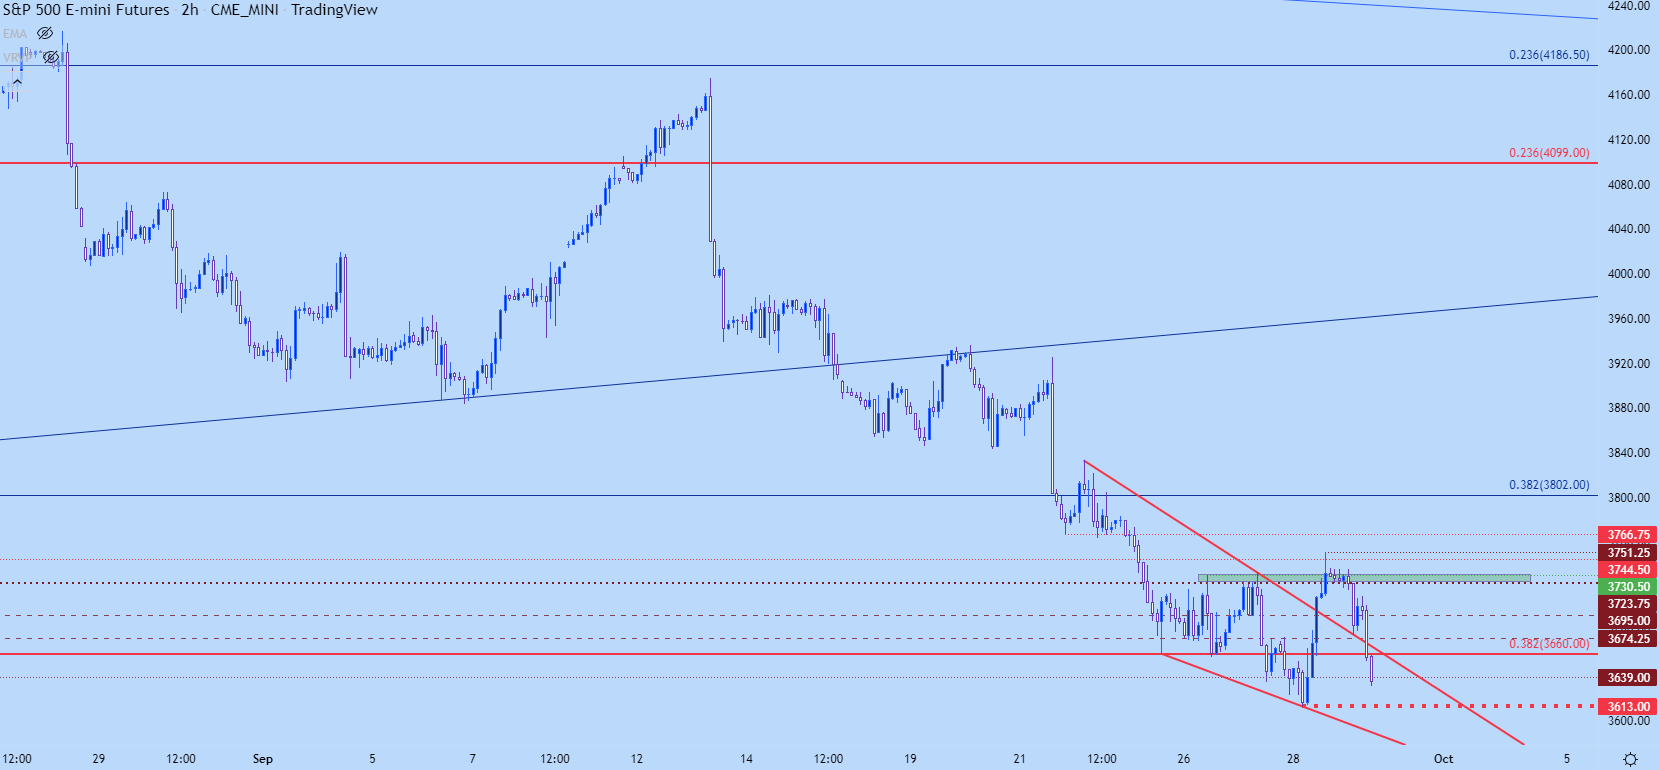
Chart prepared by James Stanley; S&P 500 on Tradingview
Quarter-End Flows
Tomorrow is the end of Q3 and there’s also the release of PCE data in the US morning to contend with. This is the Fed’s preferred inflation gauge and the big question is how much of a bullish response might we see in equities if this comes in below expectations.
This is similar to the theme that was somewhat prominent ahead of Powell’s Jackson Hole speech, when markets were trying to get in front of a possible pivot from the Fed, looking for evidence of inflation softening that may lead-in to a softer touch from the FOMC.
We haven’t seen that yet, and this morning’s jobless claims data remained hot indicating continued strength in the labor market – not what the Fed wants to see.
Longer-term, we’re still very near the June lows. We did get a test below that this week but the bearish action dried up soon after, with 3639 functioning as the June low and this week seeing sellers get down to the 3613 spot.
We’re publishing our Top Trades for Q4 at DailyFX, and the bearish side of US equities remains my choice for the third quarter in a row. From the below chart, there’s some key areas of long-term interest around psychological levels at a3500, 3400, 3300 and 3200, all of which remain relevant for the theme of risk aversion into the end of the year.

S&P 500 Weekly Chart
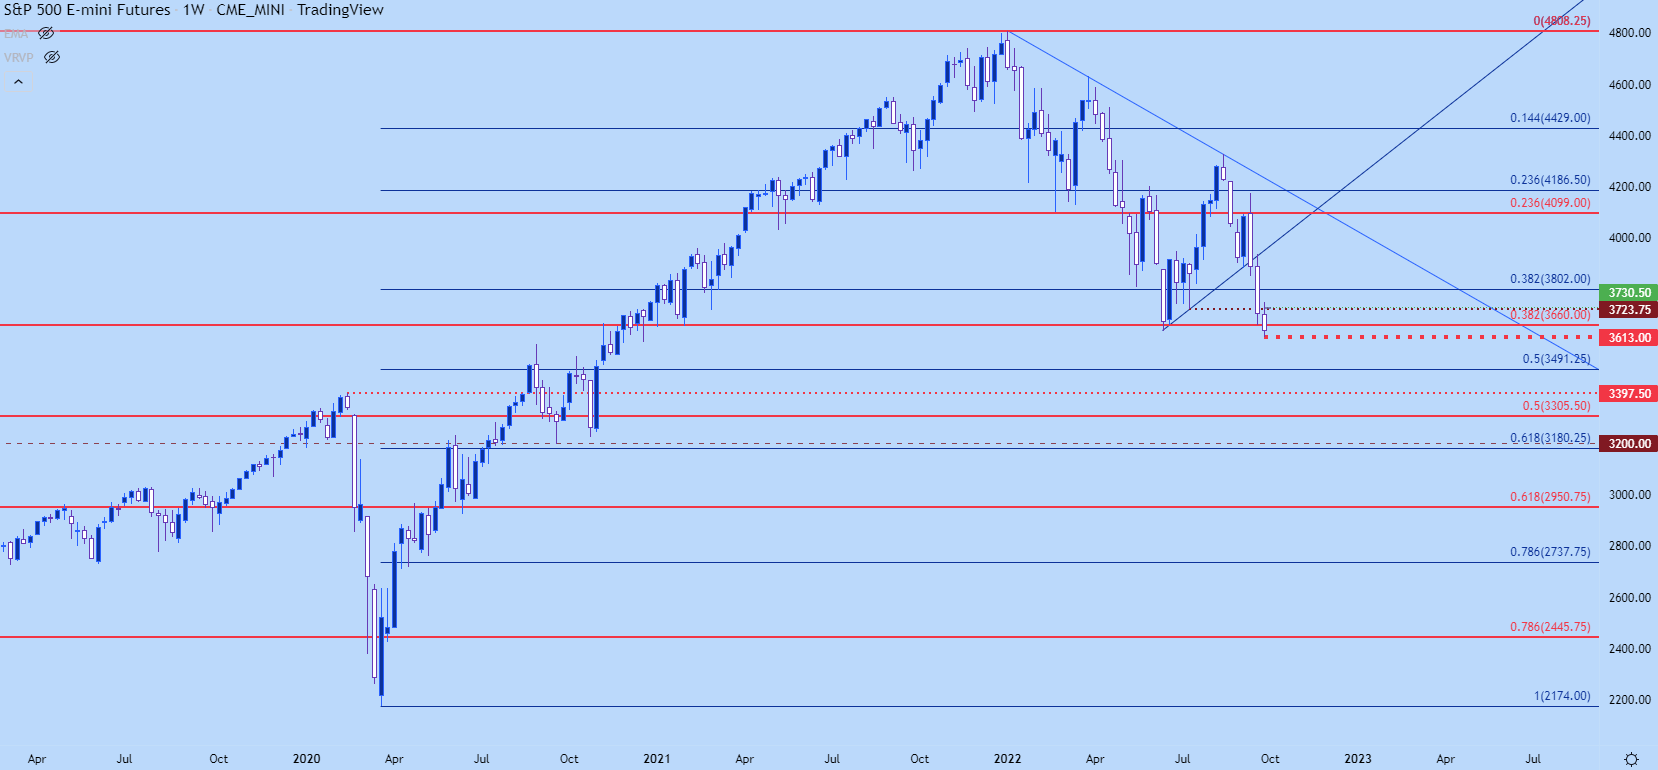
Chart prepared by James Stanley; S&P 500 on Tradingview
Nasdaq
As of this writing it looks like the Nasdaq is setting up for a test at the June low. This is a big spot of support that I’ve been tracking from the 11,294 Fibonacci level, running down to the June low at 11,069.
For next quarter, I’m focused in on a zone that runs from 9763-10000, the former of which was the pre-pandemic swing-high.
Nasdaq Weekly Price Chart
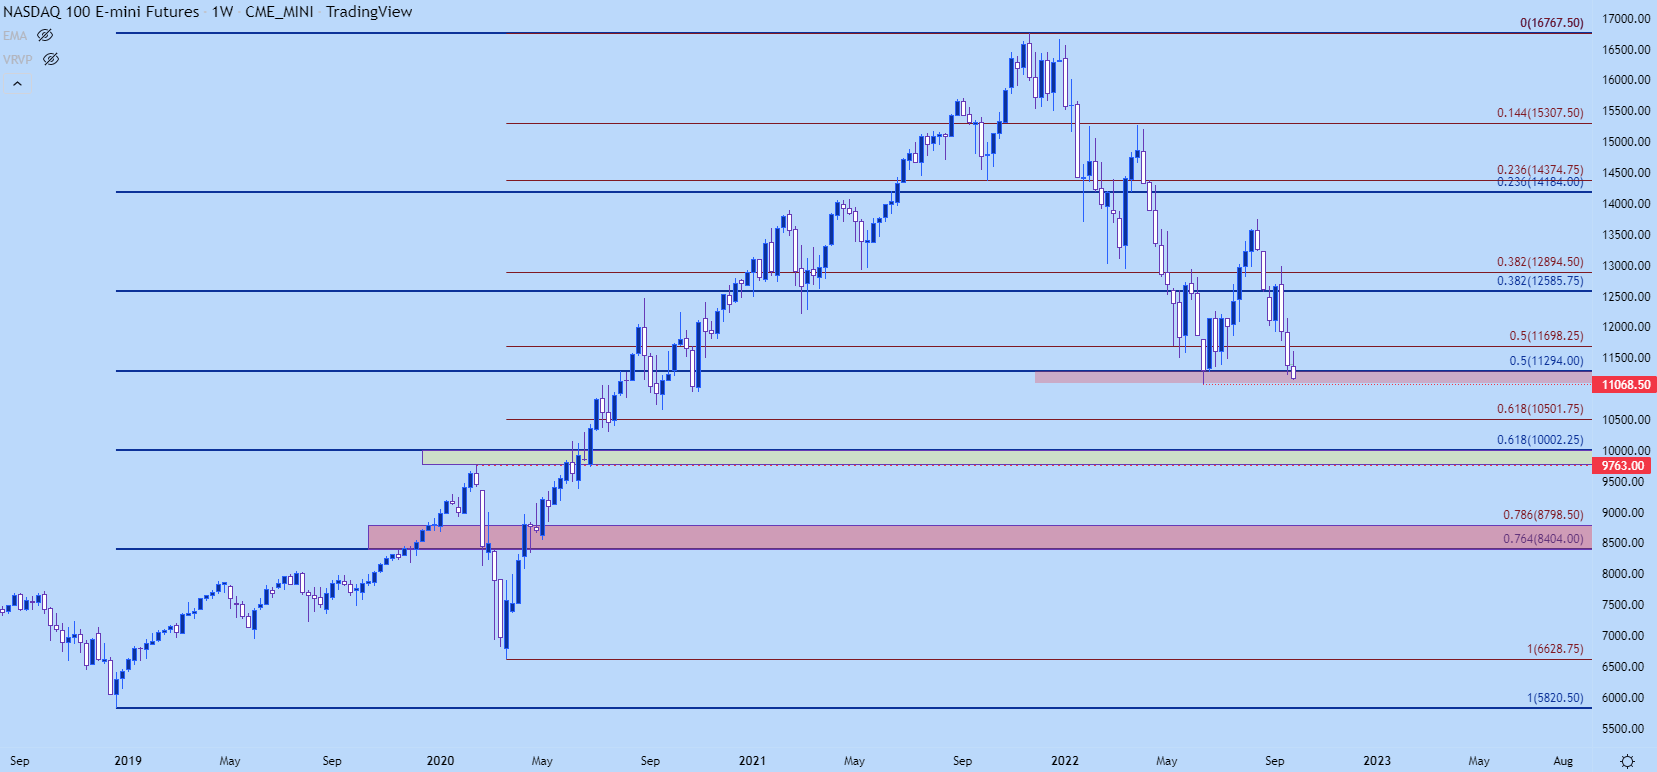
Chart prepared by James Stanley; Nasdaq 100 on Tradingview
Dow
To my eyes, the Dow looks to be in the worst shape of the three major US indices. Price has already broken-below the pre-pandemic swing-high and this week saw the index push down to its lowest point since November of 2020.
Yesterday’s rally merely pushed price right back up to resistance at prior support, and so far bears have put in a push right back down to the prior lows.
Dow Jones Weekly Price Chart
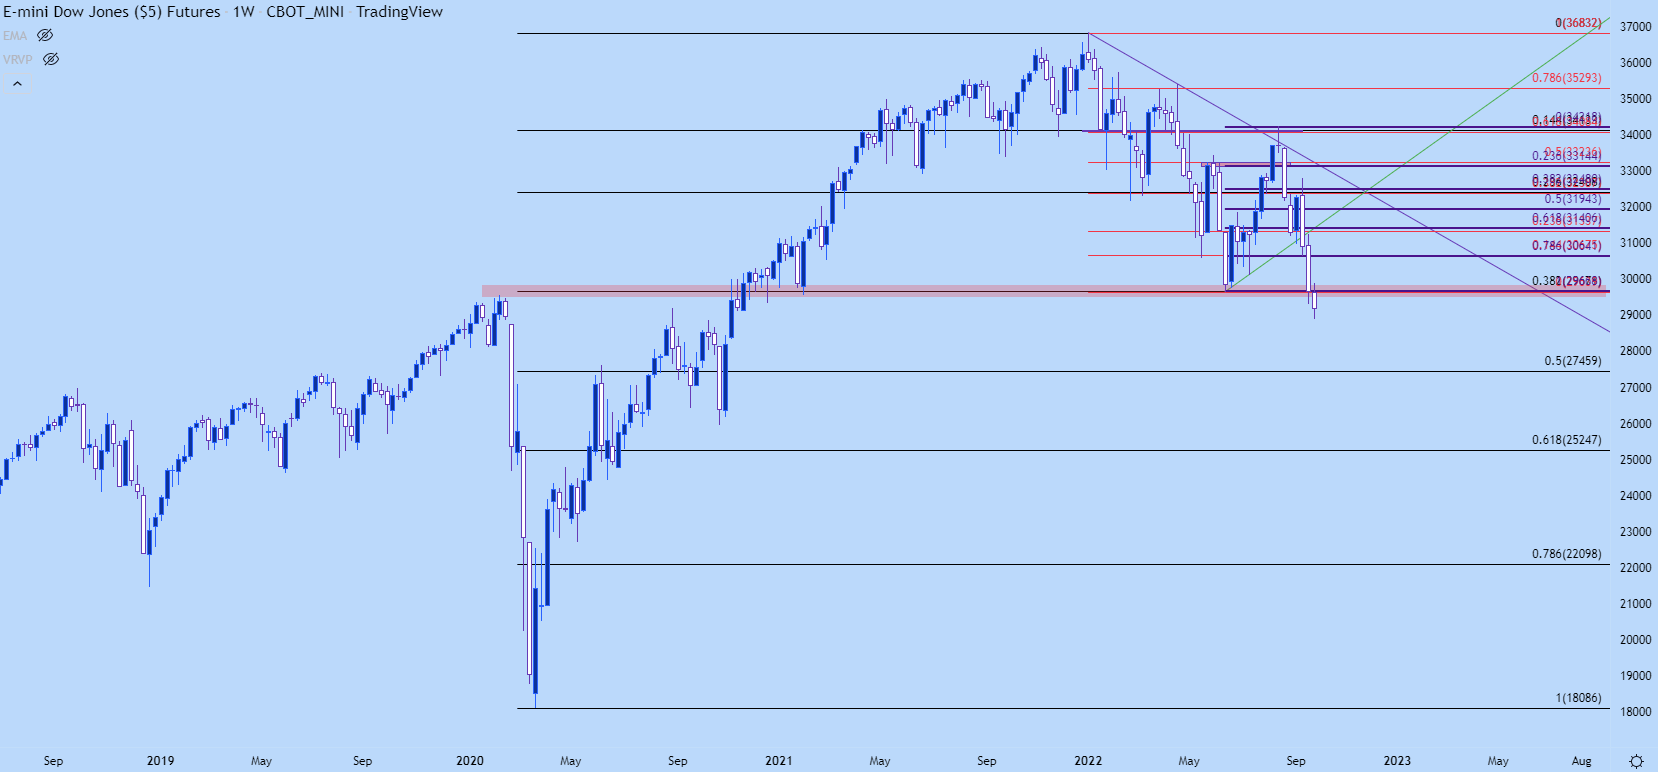
Chart prepared by James Stanley; Dow Jones on Tradingview
--- Written by James Stanley, Senior Strategist, DailyFX.com & Head of DailyFX Education
Contact and follow James on Twitter: @JStanleyFX


