

US Equities Technical Forecast: Neutral
- S&P 500 and Nasdaq 100 remain broadly biased higher
- But, near-term trends are also bearish, offering a neutral view
- What are key levels to watch for in the week ahead?

S&P 500 Outlook
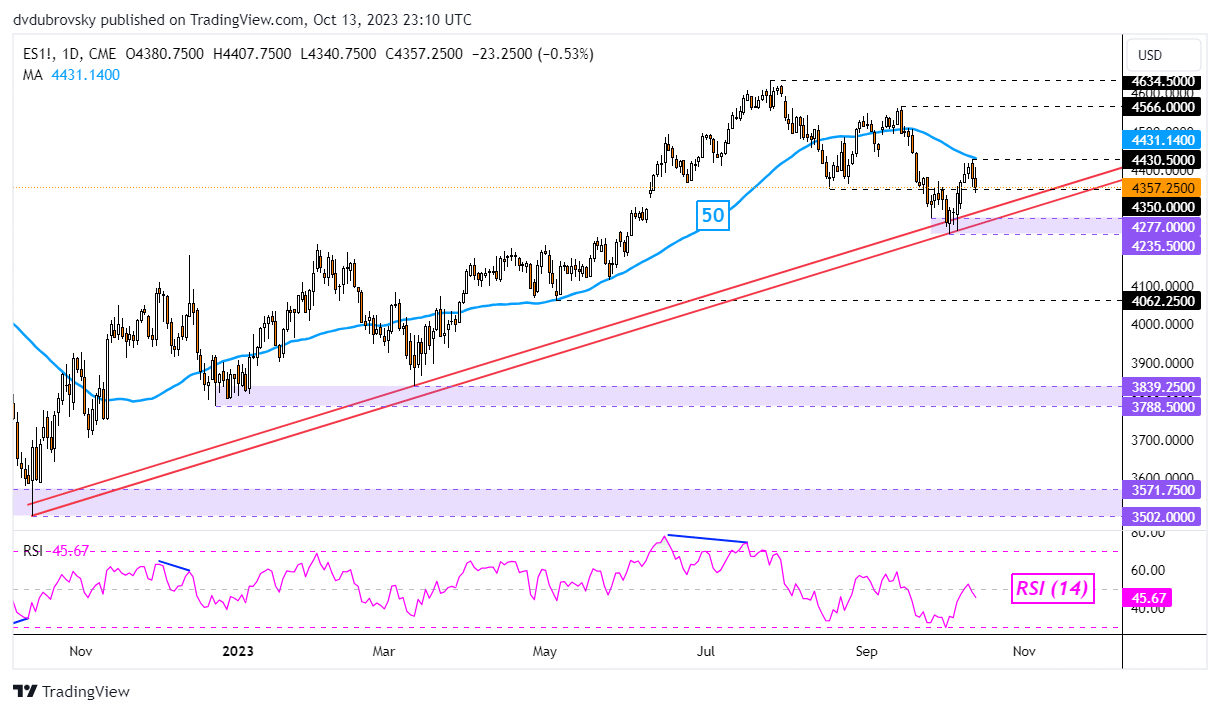
The S&P 500 completed a second weekly gain, finishing almost 0.4 percent higher over the past 5 trading days. That said, the index relinquished some gains heading into the end of the week, making for overall cautious upside performance. Still, the broader technical outlook remains broadly biased to the upside. Let us take a closer look at why.
All you have to do is look at the rising range of support from October 2022 to see why. This zone has been maintaining the dominant upside focus. Another key support zone is the 4235 – 4277 range established in September. That said, there is an argument for a near-term bearish bias considering losses since July. Key resistance is 4430.5. Clearing higher exposes the September peak of 4566.
Otherwise, clearing support offers an increasingly bearish bias towards the April low of 4062.25.
| Change in | Longs | Shorts | OI |
| Daily | -1% | 5% | 2% |
| Weekly | -6% | 8% | 2% |
Nasdaq 100 Outlook
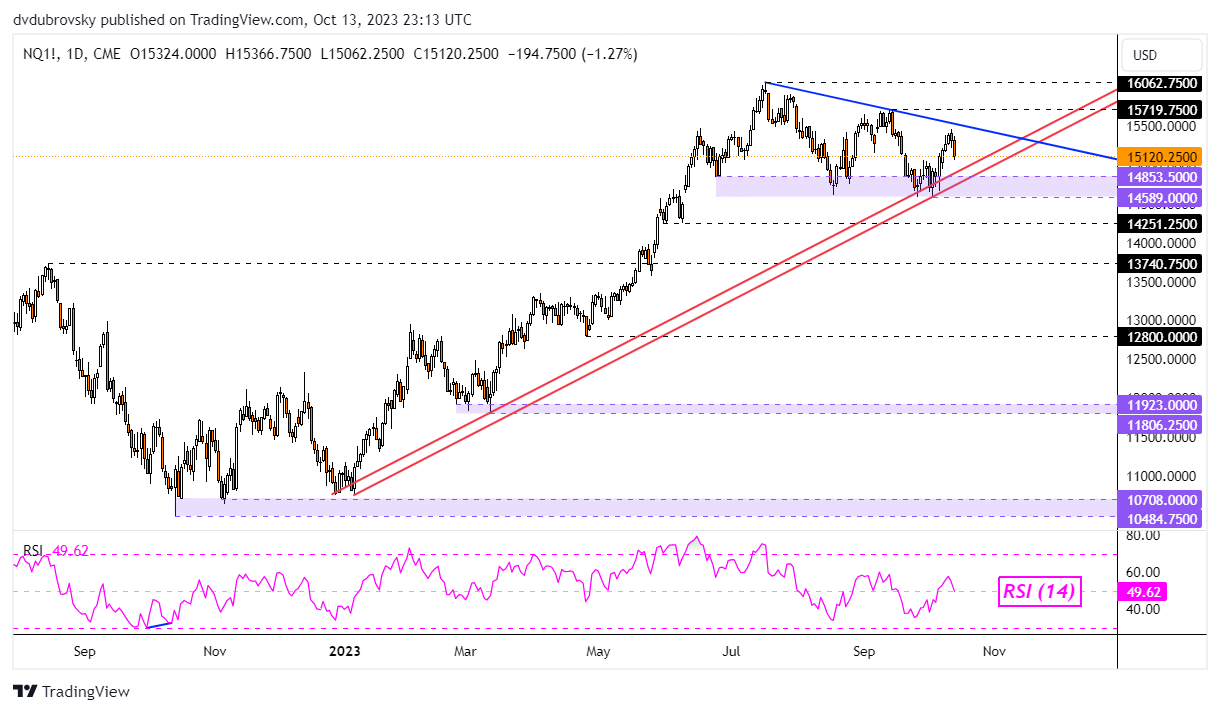
The Nasdaq 100 faces a similar situation as the S&P 500. Losses later in the week meant that the tech-heavy index finished little changed. That said, the broader bullish bias is being upheld by a rising range of support from the beginning of this year. Coupled with the 14589 – 14853 support zone, the Nasdaq may find it difficult to breach meaningfully lower.
At the same time, losses since July have been offering a short-term bearish technical bias. A falling trendline from then (blue line below) is also holding as resistance, maintaining the downside focus. Clearing lower exposes the June low of 14251 before the 13740 inflection zone kicks in. On the other hand, reversing higher may open the door to revisiting the July peak.

--- Written by Daniel Dubrovsky, Contributing Senior Strategist for DailyFX.com