

The S&P 500 has recovered significantly in 2023, up more than 13% year-to-date, driven by the tech sector's phenomenal bullish momentum on the back of optimism and speculation that the advent of “artificial intelligence" will boost productivity and, ultimately, revenues.
For much of the 2023 rally, breadth was poor, although it got better later, but the improvement was insufficient to indicate broad participation. Generally, when market internals are weak and only a few players are responsible for positive index performance, gains tend to be short-lived.
Granted, AI could lead companies to expand profits down the road, though it will not be a game changer immediately, but even if it were at the margin, there is one important risk that should not be neglected: feeble fundamentals.
In recent quarters, the extraordinary resilience of the U.S. economy, together with inflation, has helped sustain corporate profits, leading many analysts to wrongly assume that the worst is over and that the light at the end of the tunnel is getting closer. This assessment, however, may be too optimistic.
While it is true that the economy has been able to withstand numerous challenges without much damage so far, the tide could turn soon. With interest rates hovering around 5.0% and the Federal Reserve intent on delivering 50 basis points of additional hikes this cycle, it is only a matter of time before the macroeconomic outlook succumbs to the pressure of the central bank's overly restrictive stance.
The fact that monetary policy acts with long and variable lags likely explains why aggregate demand has been impervious to the Fed’s forceful hiking campaign, but as the impact of tighter credit conditions feeds through the real economy, the specter of recession should come back into frame.
Getting the timing right can be tricky, but the steady rise in U.S. unemployment claims in June may be a sign that the labor market is about to crack. For this reason, it is key to follow jobs data closely, recognizing that the day of reckoning for bulls may come when the first negative nonfarm payrolls report arrives.

Aside from a possible recession and its detrimental impact on earnings, there are other risks worth highlighting, the first being falling inflation. While the downward trend in CPI is great for consumers, it negative for revenue growth and profit margins. These dynamics should become more evident for Wall Street once the second-quarter reporting period gets underway in July.
The other headwind looming over stocks is thinner liquidity. As the U.S. government increases Treasury issuance to boost its coffers by about $1.2 trillion following the debt-ceiling saga, bank reserves in the system could shrink in a meaningful manner, reducing the money supply. Needless to say, this would be bad for risk assets.
For all the above reasons, the S&P 500 could be in for a rude awakening and suffer a large downward correction in the third quarter – an event that would help remove some of the froth that has built up during the 2023 market rally. In this sense, bearish setups look more attractive from a risk-reward proposition.
Personally, I would wait for a moderate pullback before considering bets against the S&P 500, perhaps on a break of a key support area, not before. If market morale is already bruised, negative sentiment can reinforce weakness, benefiting short positions.
Looking at the S&P 500 weekly chart, a technical zone that could pull sellers back if broken is the psychological 4,200 level, where the February swing high aligns with the 50-day simple moving average and the rising trendline from the March lows.
Failure to hold above 4,200 could lead to strong follow-through selling, setting the stage for a move toward 4,085, the 38.2% Fibonacci retracement of the October 2022/ June 2023 leg higher. Further losses could be in store if prices breach this floor, with the next support at 4,005, slightly above the 200-day simple moving average and the rising trendline extended off last year’s low.
| Change in | Longs | Shorts | OI |
| Daily | -3% | -1% | -2% |
| Weekly | -5% | -3% | -4% |
S&P 500 Weekly Chart
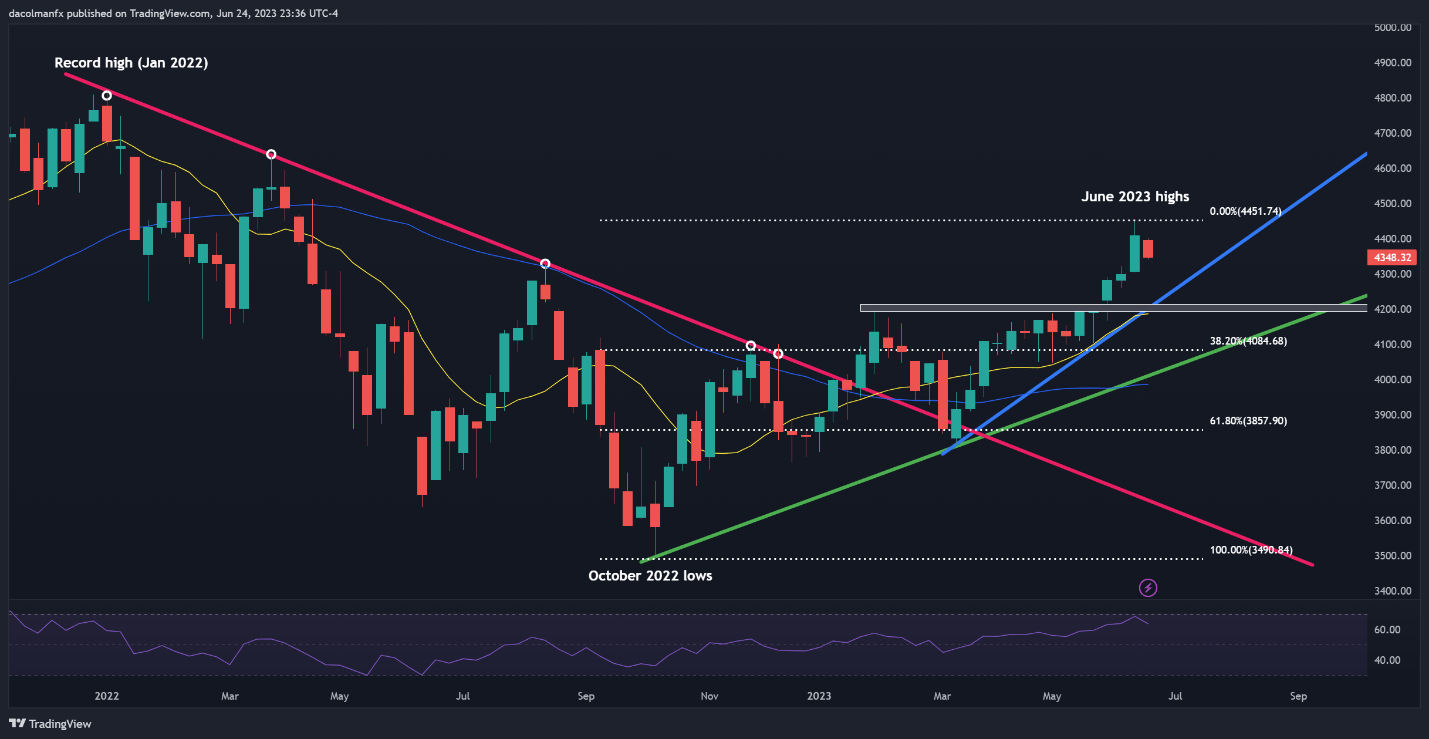
Source: TradingView