


Oil Prices, Charts, and Analysis
- Oil prices re-test multi-month highs
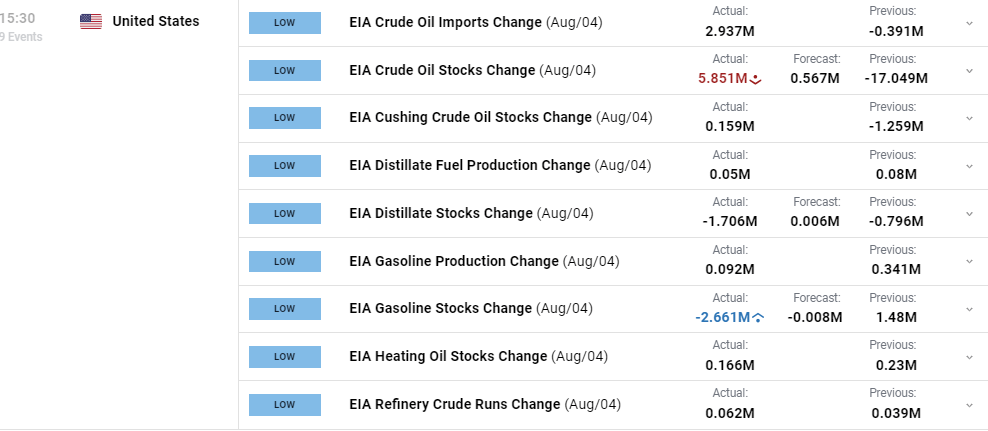
- EIA crude oil stocks rise, gasoline stocks fall.

The price of oil continues to press higher despite an unexpected build in EIA crude oil stocks. After last week’s unexpectedly large fall, today’s build should press down on the price of oil, but taken as a two-week outlook, the crude oil draw remains large. Gasoline stocks showed an unexpected drawdown.
For all market-moving events and economic data releases, see the real-time DailyFX Calendar
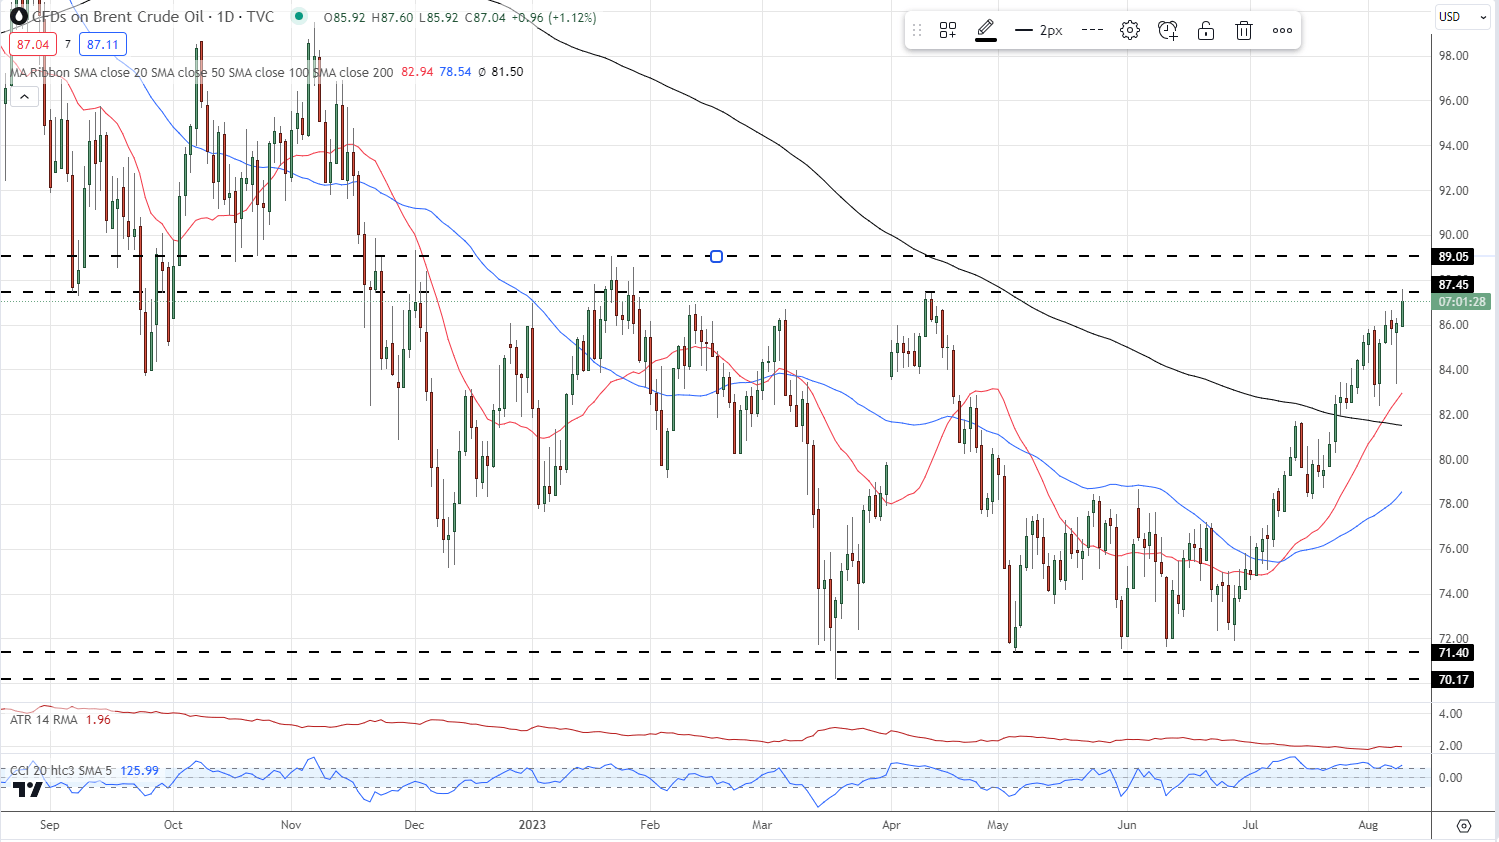
The price of Brent oil continues its clean move higher after the multi-touch bounce off the $71.40 level in May and June. The daily chart shows a multi-week set of higher highs and higher lows with all three simple moving averages also providing support. On a longer basis, the series of lower highs made from March 2022 now looks to be broken, another positive sentiment boost. The next upside target comes in at $89.05/bbl. Markets continue to price in a soft landing in the US with market expectations now that the Federal Reserve will keep rates unchanged until early-2024 before they start trimming rates.
Brent Oil Daily Price Chart – August 9, 2023
The US oil chart is very similar to the UK oil chart but has already broken above the mid-April high. Again all three simple moving averages provide bullish support.
US Oil Daily Price Chart – August 9, 2023
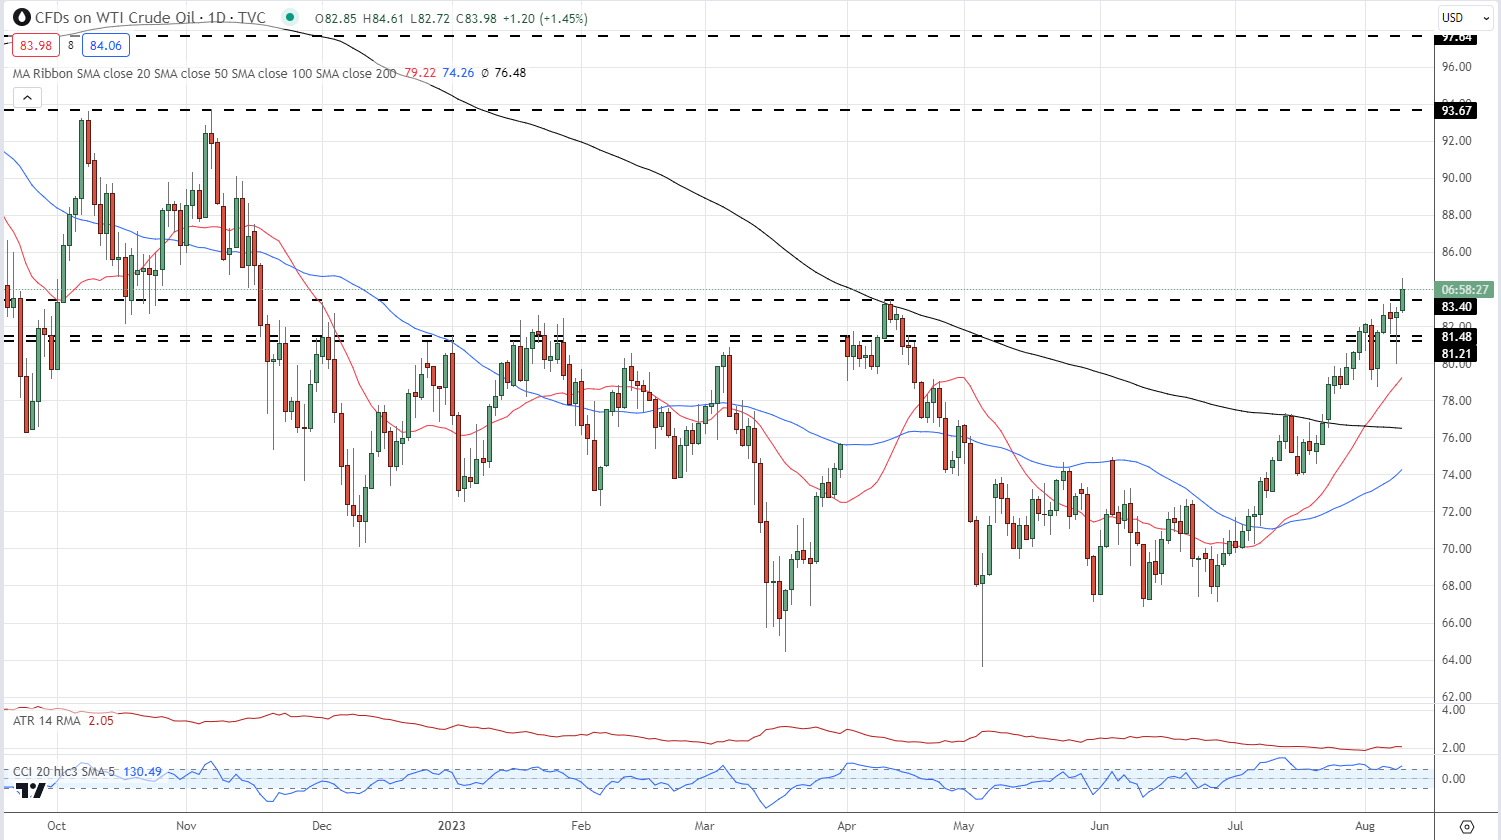
Charts via TradingView
Retail trader data shows 38.39% of US crude oil traders are net-long with the ratio of traders short to long at 1.60 to 1.
You can download the full US oil sentiment report below.
| Change in | Longs | Shorts | OI |
| Daily | -7% | 14% | -4% |
| Weekly | 7% | 2% | 6% |
What is your view on the Oil – bullish or bearish?? You can let us know via the form at the end of this piece or you can contact the author via Twitter @nickcawley1.


