


Oil (Brent Crude, WTI) Analysis
- Brent crude oil backs off after Houthi strike
- WTI oil breaches long-term trend marker to the downside
- Find out what oil markets have in store during the first quarter by downloading our Oil Forecast for Q1 below:

Brent Crude Oil Backs Off After Houthi Strike
Brent crude oil was making a marvelous recovery since it consolidated in the early days of 2024 but such upward momentum has not only stalled, but cut back somewhat. After breaching the $83.50 mark, UK oil trade softened, closing around $82 flat yesterday and opening this morning a tad below yesterday’s close as markets continue to tread with caution.
Prior targeted vessels in the Red Sea had not included oil or refined products, meaning the strike over the weekend marked the first of its kind, potentially altering the flow of oil through the Red Sea if other carries heed the warning.
The 200-day simple moving average is the immediate level of support currently being tested, where a further decline could test the 50 SMA around $78.70. The MACD is yet to see a flip in momentum to the downside, holding out for some stability in prices ahead of US API data and EIA storage data tomorrow.
Brent Crude Oil (UK Oil) Daily Chart
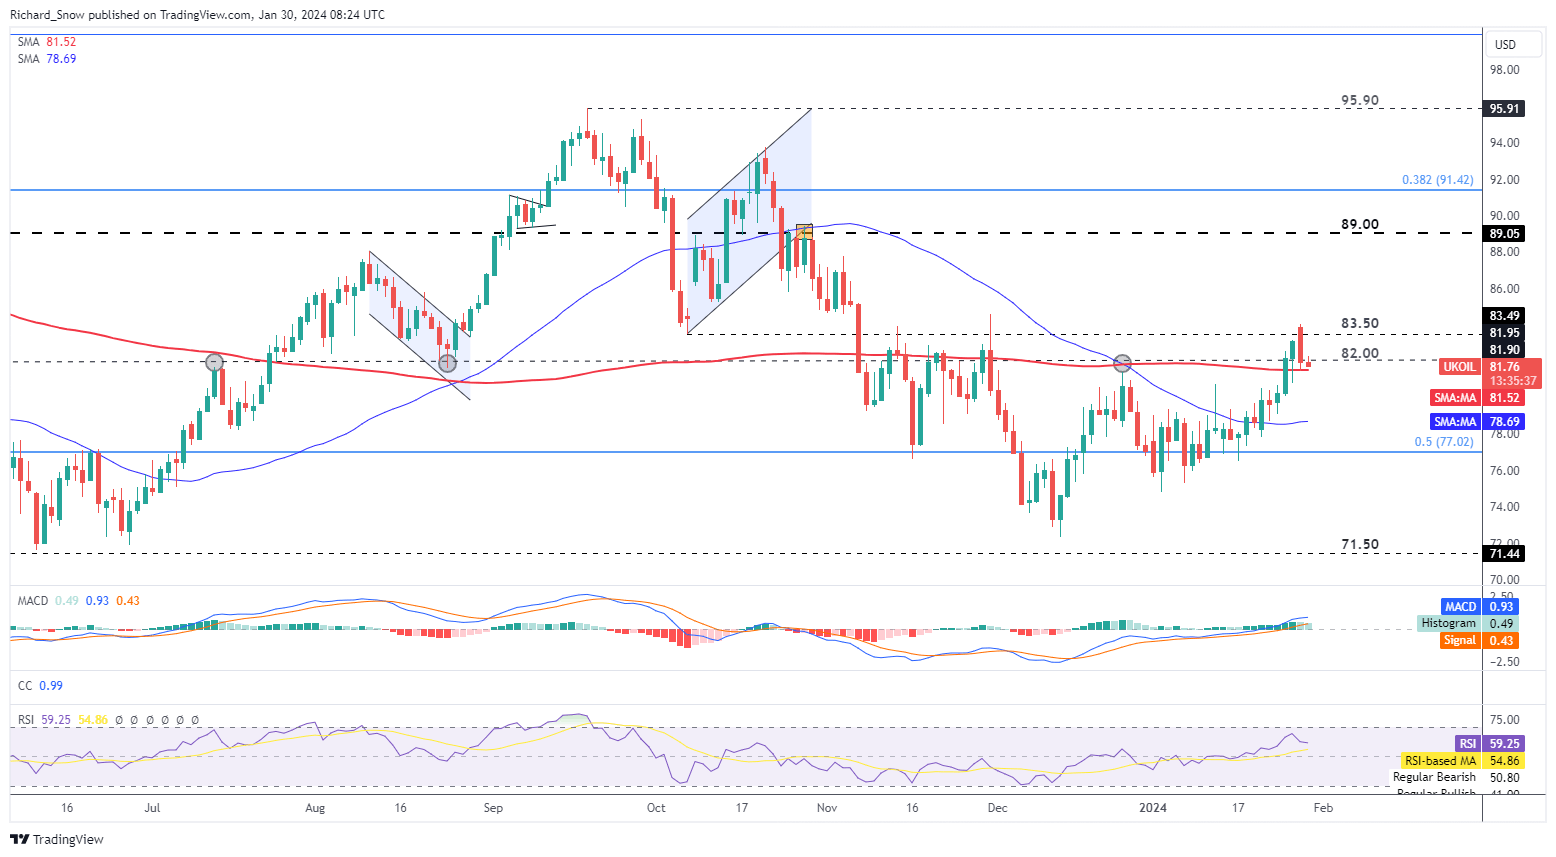
Source: TradingView, prepared by Richard Snow
Oil prices enjoyed a spate of increases as a result of extreme weather conditions. Icy conditions befell the Dakota and Texas oil fields, adversely impacting crude output by around 1 million barrels per day (bpd) in the week ending January the 19th. Adding to the bullish wave of support for oil prices was the positive surprise in US GDP for the fourth quarter (3.3% vs 2% expected).
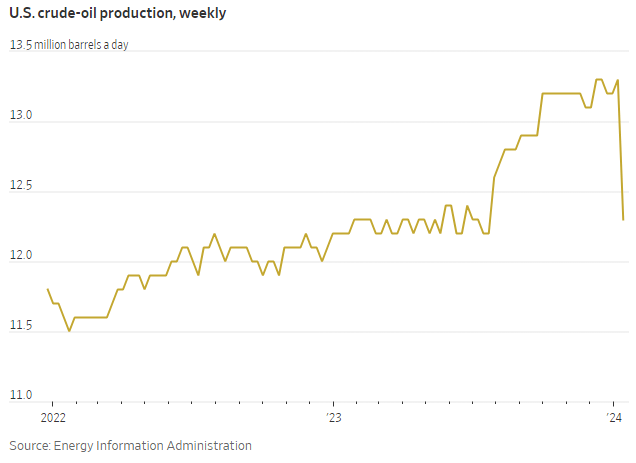
Source: Wall Street Journal, EIA, prepared by Richard Snow
WTI Oil Breaches Long-Term Trend Marker to the Downside
WTI oil turned lower, passing beneath the 200 SMA and the long-term level of significance $77.40. The next level of potential support is the 50 SMA around $73.63 and $72.50. The RSI had neared overbought levels but fell short as prices turned lower but positive upside momentum remains intact for now.
Major economic news and data awaits as this week the Fed provide an update on monetary policy and US jobs data trickles in until NFP on Friday.
WTI Oil Daily Chart
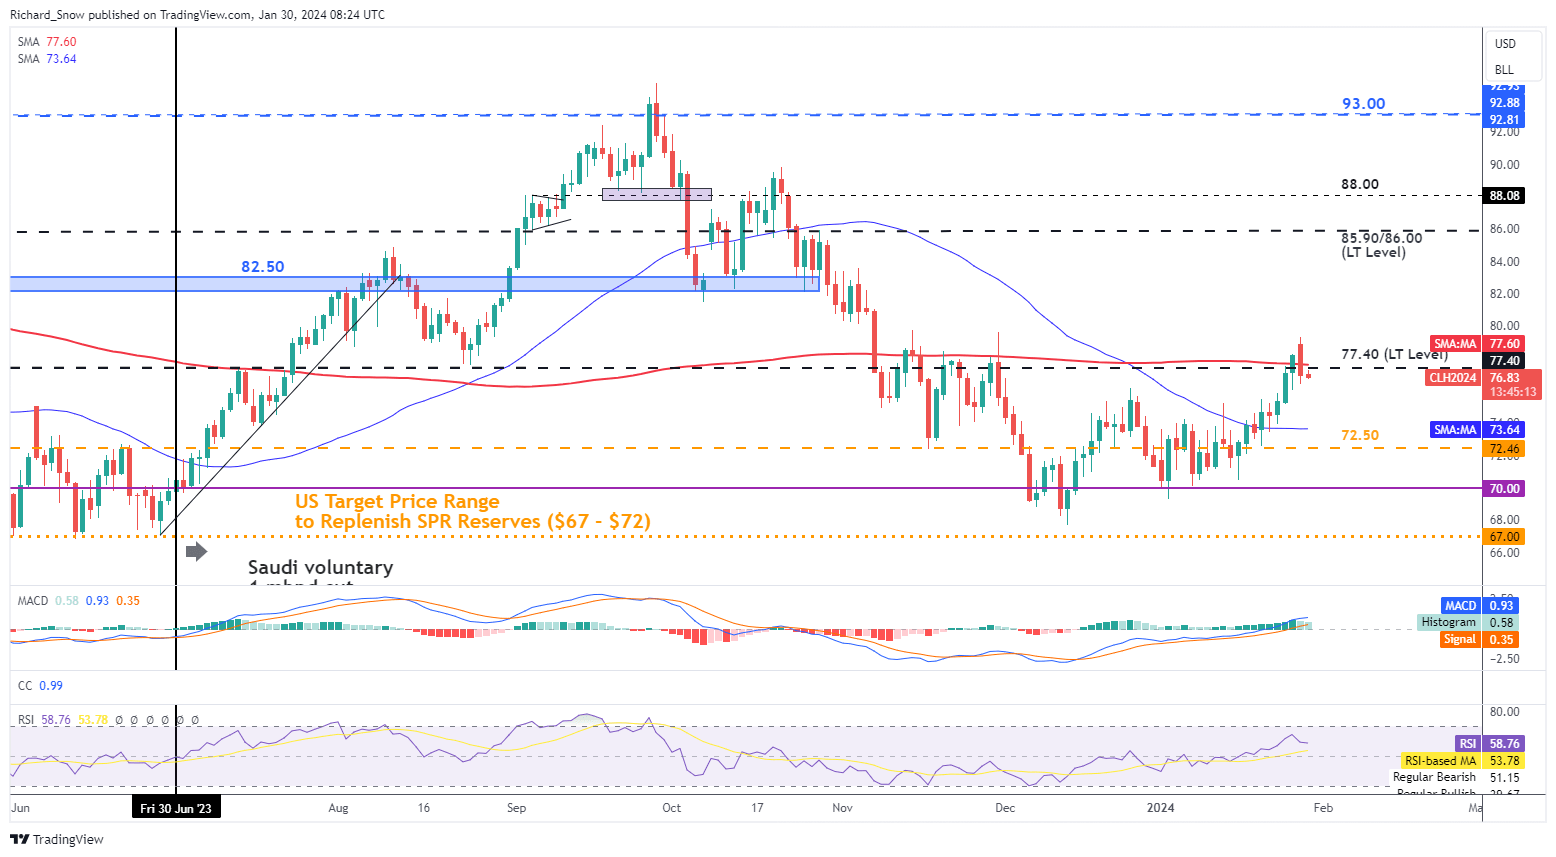
Source: TradingView, prepared by Richard Snow

Later today, API stock data is due, followed by EIA storage data tomorrow:
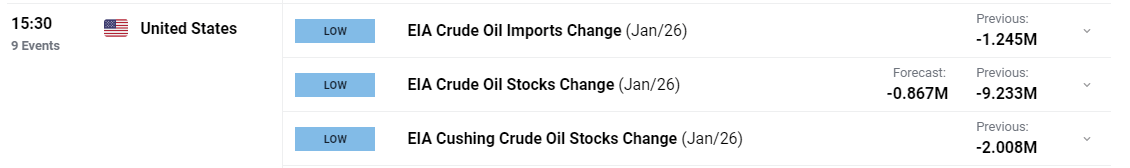
Customize and filter live economic data via our DailyFX economic calendar
--- Written by Richard Snow for DailyFX.com
Contact and follow Richard on Twitter: @RichardSnowFX


