


Oil (WTI) News and Analysis
- WTI on track for fourth straight day of declines on demand concerns, stronger USD
- WTI attempts to fill in the OPEC-inspired gap with the 50 SMA in sight
- The analysis in this article makes use of chart patterns and key support and resistance levels. For more information visit our comprehensive education library

WTI on Track for Forth Straight Day of Declines on Demand Concerns, Stronger USD
Oil continues to selloff after posting the monthly high last week of around $83.53 when looking at the continuous futures chart (CL1!) as a relatively stronger dollar and global demand concerns weigh on the energy commodity.
The calm witnessed in the banking sector has allowed major central banks to refocus their attention on driving down core inflation as a number of sticky prints for March necessitated an upward shift in rate expectations. Tighter financial conditions and tighter credit conditions – highlighted in the Fed’s Beige Book report yesterday – add to global growth concerns ahead of next week’s Q1 US GDP print. The combination of even tighter financial conditions leading to global demand concerns coupled with slight pick up in the dollar, appear to have helped ease oil prices over the last 4 days.
Oil prices continued to drop despite a weekly draw on US crude oil stocks for the week ending 14 April as shown below:
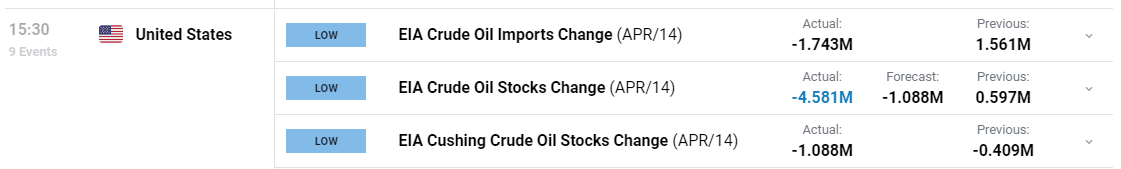
Customize and filter live economic data via our DailyFX economic calendar

WTI Technical Analysis: Gap Fill in Progress
After briefly breaching the zone of resistance and reversing at the 200 simple moving average (SMA), WTI now attempts to fill the price gap created by OPEC’s surprise output cut at the end of April which is said to remove 1.16 million barrels per day (mbpd) of production. See the chart below for the breakdown of the cuts per OPEC member nation:
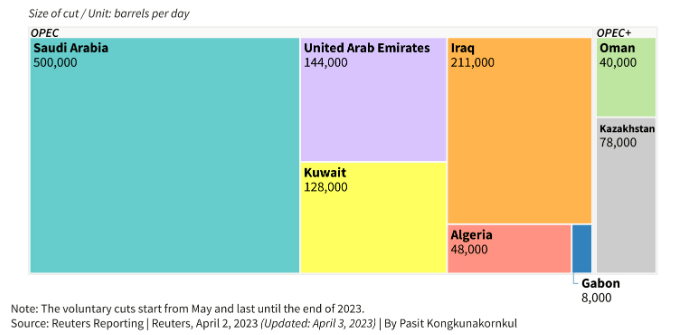
Source: Reuters
Immediate support appears via the long-term level of significance at $77.40 with the 50 SMA appearing not too far from there. Now that oil prices have attempted to bridge the gap, a further decline towards $75.75 would achieve that goal. Since the output cuts are only expected to come into effect at the beginning of May, there is capacity for a bearish continuation but considering the increasingly tight oil market, lower prices aren’t expected to remain in the longer-term. Resistance appears back at the hugely influential $82.50 zone and the 200 SMA.
WTI Futures Daily Chart
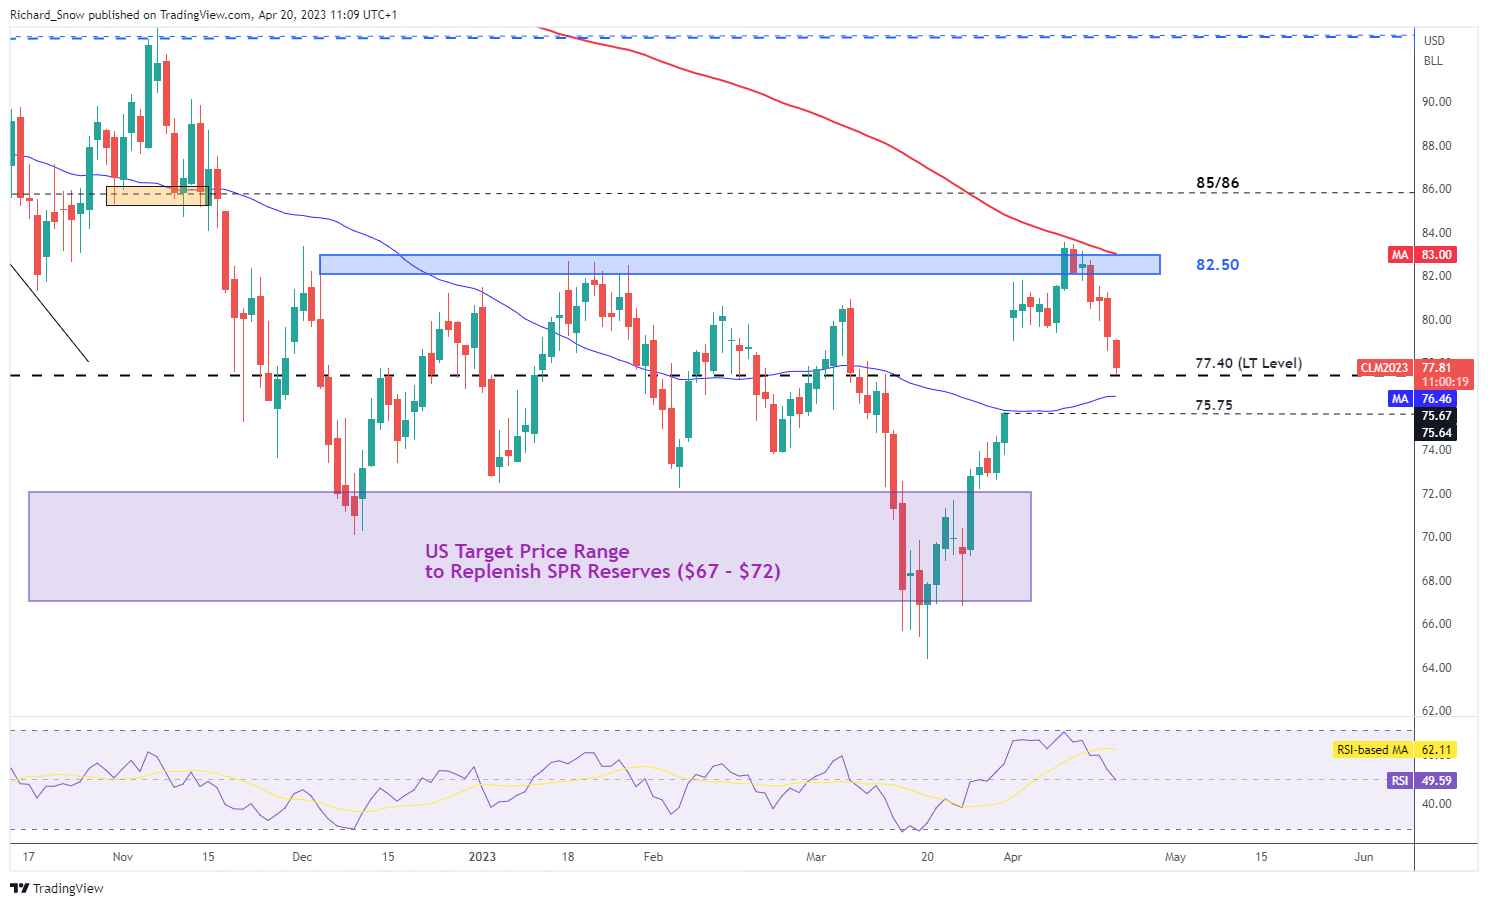
Source: TradingView, prepared by Richard Snow
--- Written by Richard Snow for DailyFX.com
Contact and follow Richard on Twitter: @RichardSnowFX


