
Oil Analysis, Prices, and Charts
- The virtual OPEC+ meeting starts on Thursday and may prove fractious.
- Oil prices are set to tread water ahead of any announcements.
Download our complimentary guide on How to Trade Oil

The oil market may see a further bout of volatility going into the end of the week as OPEC+ members lay out their arguments for 2024 production quotas. Any further production cuts would underpin the price of oil and likely see prices move higher, while any increase in production would weigh further on oil and press the price further lower. OPEC+ will have a difficult task balancing various members' wishes and this week’s meeting will leave some members unhappy with the outcome, further adding to market unrest.
The technical outlook for US oil remains negative with the current spot price closing in on another multi-month low. Spot US oil is now below all three simple moving averages, having made a confirmed break below the 200-dsma last week, and there is little in the way of any substantial support ahead of $70.35/bbl. (7.6% Fibonacci retracement) and then the $67/bbl. area. For oil to move higher, the 61.8% Fib retracement at $75.68/bbl. needs to turn into support before the 200-dsma at $78/bbl. comes into focus.
Oil Daily Price Chart – November 28, 2023
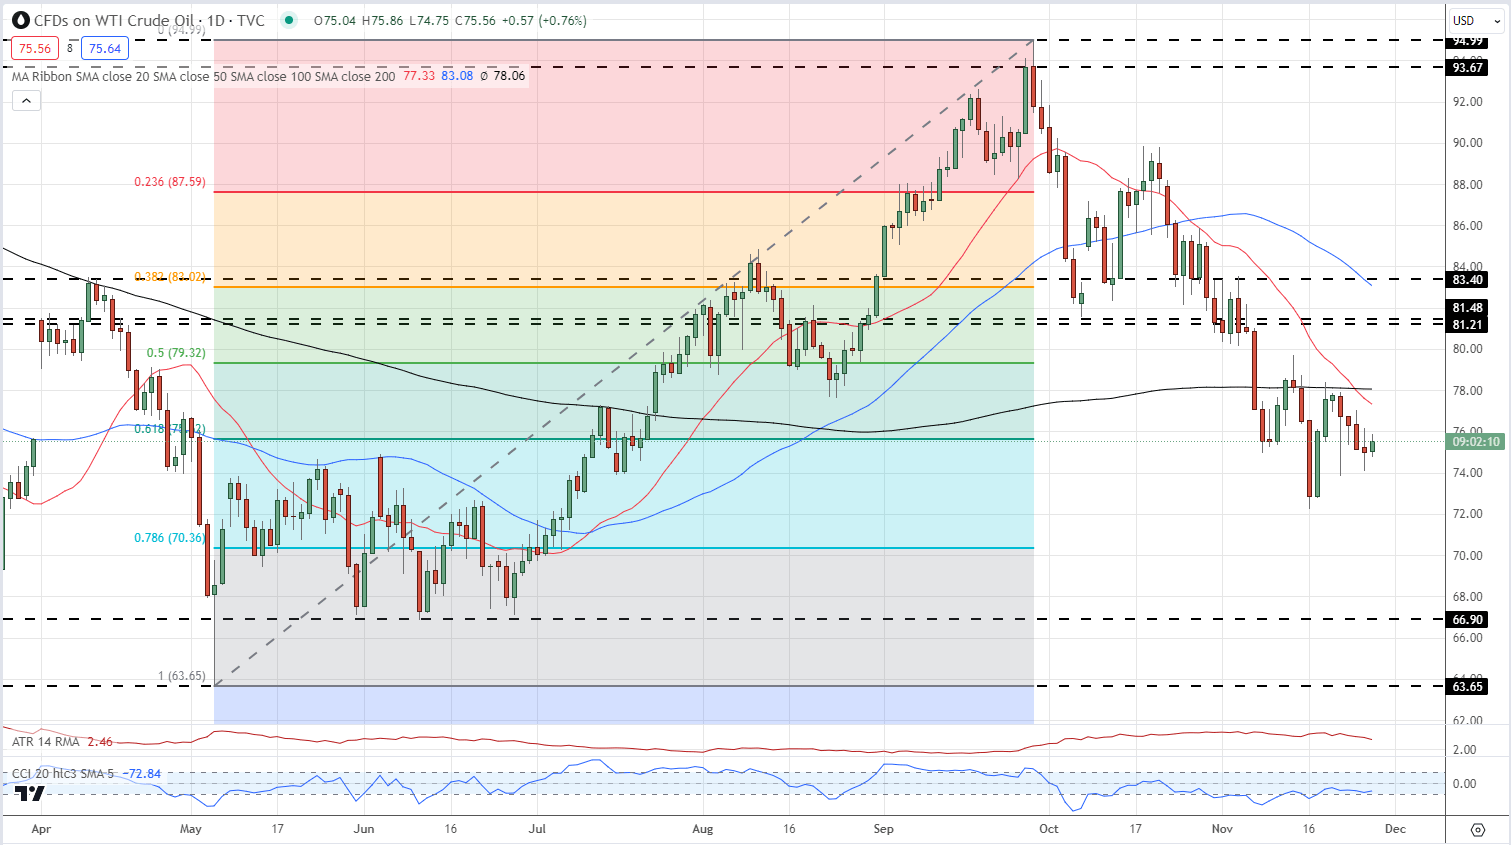
Chart via TradingView
IG Retail Trader data shows 82.64% of traders are net-long with the ratio of traders long to short at 4.76 to 1.The number of traders net-long is 0.28% higher than yesterday and 7.08% higher than last week, while the number of traders net-short is 1.93% lower than yesterday and 17.23% lower than last week. We typically take a contrarian view to crowd sentiment, and the fact traders are net-long suggestsOil- US Crude prices may continue to fall.
Download the latest Sentiment Report to see how these daily and weekly changes affect price sentiment
| Change in | Longs | Shorts | OI |
| Daily | 2% | -12% | -2% |
| Weekly | 4% | -20% | -4% |
What is your view on Oil – bullish or bearish?? You can let us know via the form at the end of this piece or you can contact the author via Twitter @nickcawley1.