


Nasdaq Analysis
- Tech stocks continue upward momentum ahead of Tesla, Netflix earnings
- Nasdaq approached the all-time high of 16,767 – could tech EPS beats provide the catalyst?
- The analysis in this article makes use of chart patterns and key support and resistance levels. For more information visit our comprehensive education library

Tech Stocks Continue Upward Momentum Ahead of Tesla, Netflix Earnings
The Nasdaq index continued its latest surge higher, buoyed by largely positive earnings from the major US banks. Banks apart from Goldman Sachs and Citi beat EPS estimates as interest rates continue higher in the US. Big banks typically see an increase in net interest income during rate hiking cycles but when rates become too restrictive, customers become more likely to default on their loans.
The recent progress in core inflation has also played a part in the bullish run, adding more fuel to the fire. Signs of disinflation have accumulated in the US, which adds less pressure on the Fed to hike aggressively.
Nasdaq Approaching a Test of the All-Time High
The weekly Nasdaq chart shows the bullish run touching the upper side of the ascending channel which has contained price action since the start of the major move higher towards the end of last year. There is a fair distance from current levels to a retest if the all-time high but at the current rate, the upside level of 16,767 could be in sight very soon.
Nasdaq (E-Mini Futures) Weekly Chart
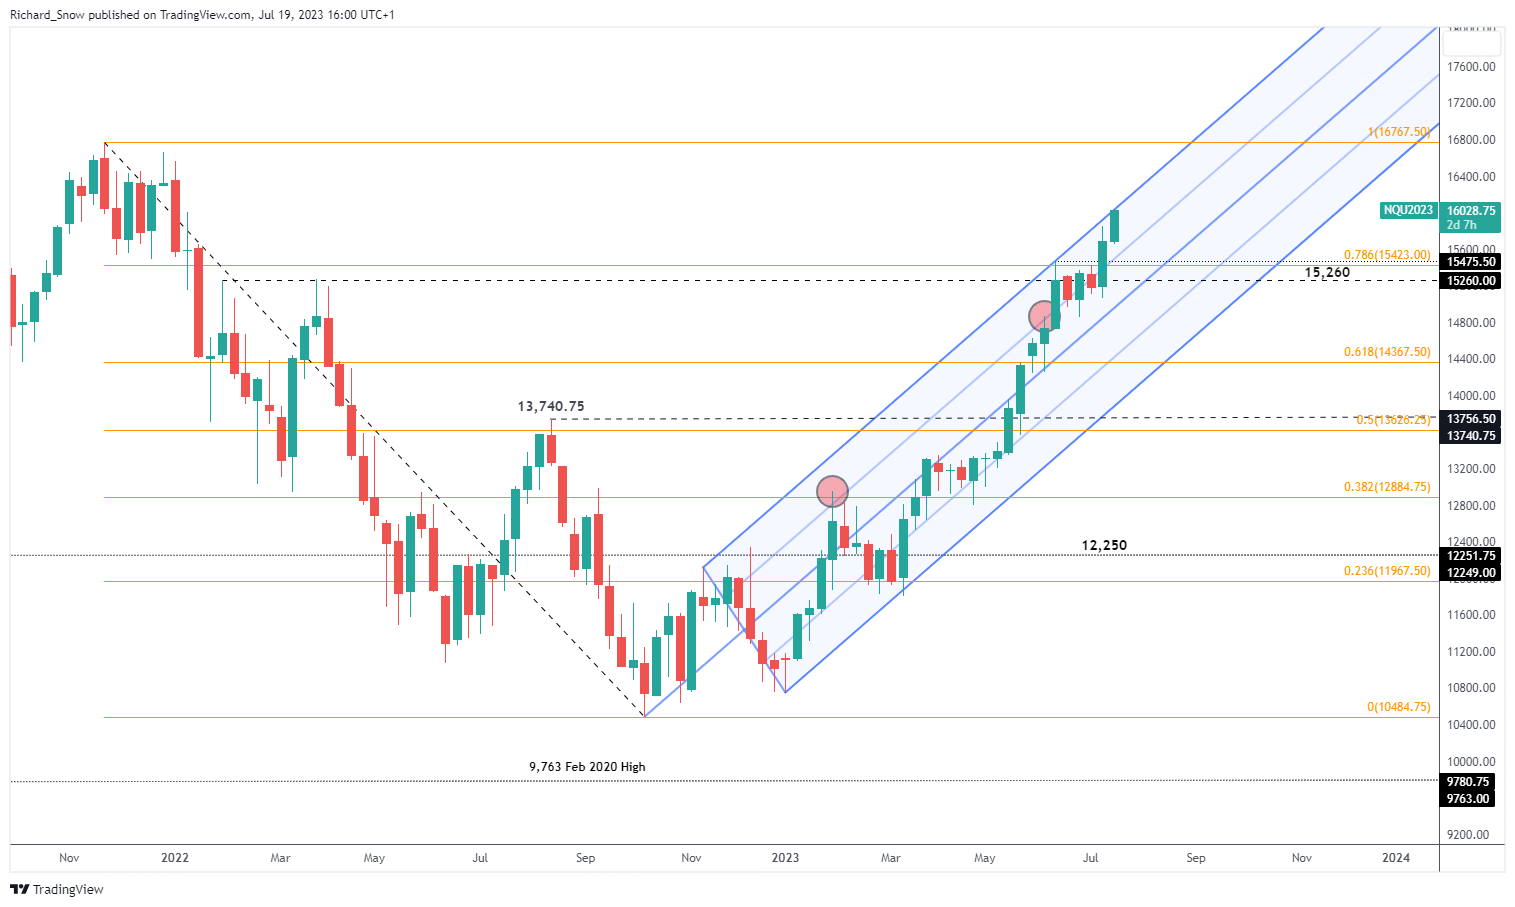
Source: TradingView, prepared by Richard Snow
Next up on the earnings calendar are the quarterly reports from Tesla and Netflix which are due after market close today.
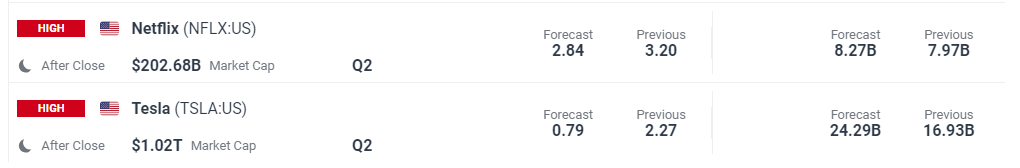
Customize and filter live economic data via our DailyFX earnings calendar
The daily chart helps to assess the sheer momentum behind the bullish move, characterised by a distinct lack of counter-trend pullbacks. More recently, prices consolidated 15,260 before the current advance took hold. Passing through 15,710 with ease, the index now has the all-time high back within touching distance – if positive earnings reports can provide the catalyst.
Nasdaq (E-Mini Futures) Daily Chart
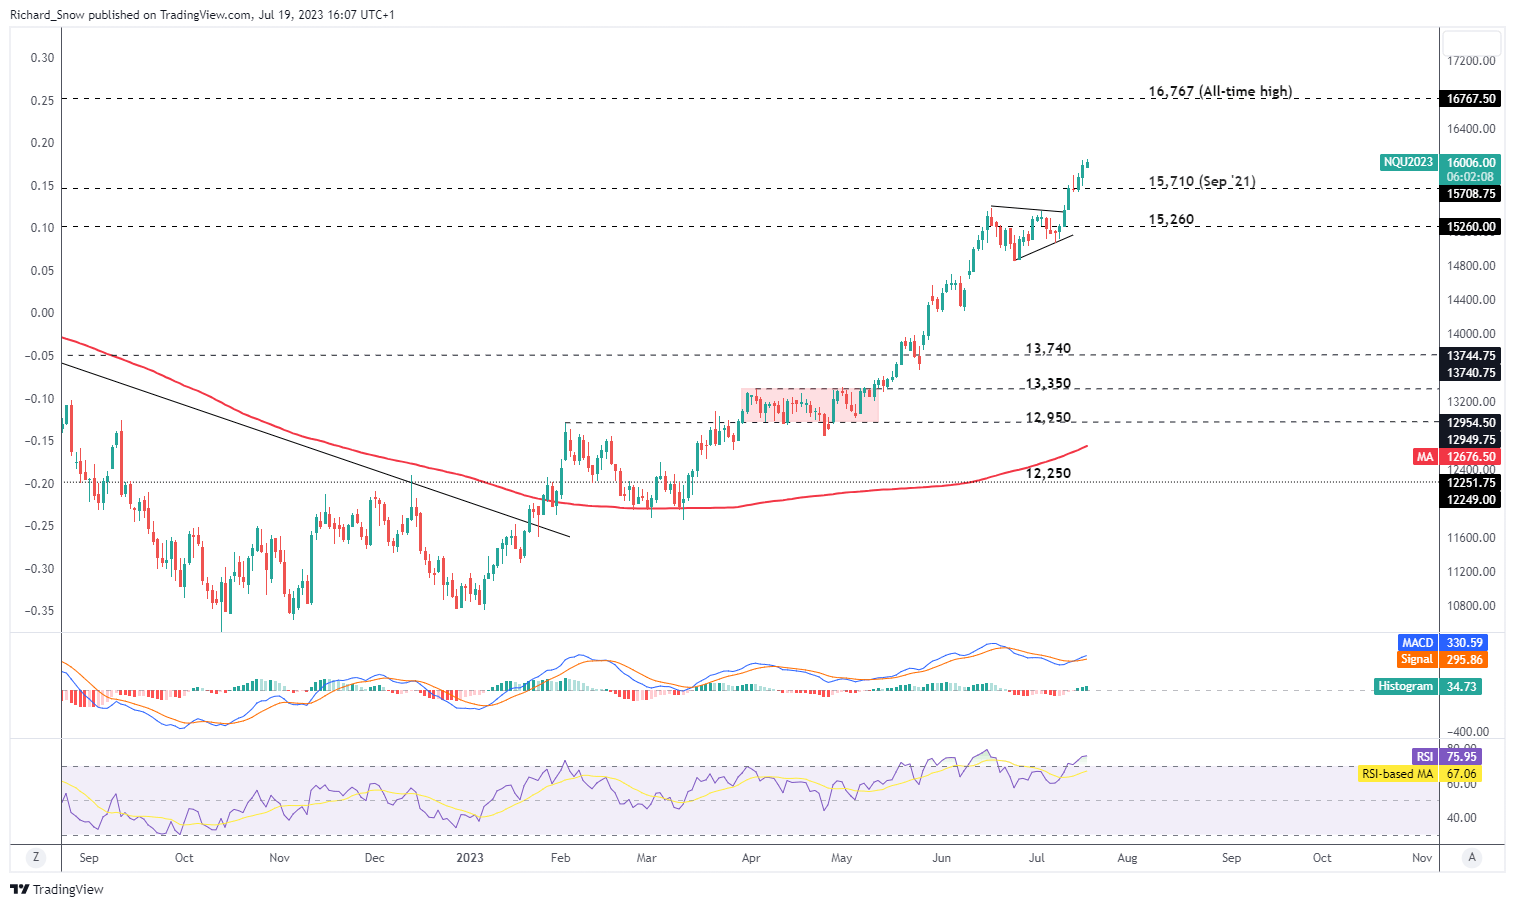
Source: TradingView, prepared by Richard Snow

--- Written by Richard Snow for DailyFX.com
Contact and follow Richard on Twitter: @RichardSnowFX


