
NASDAQ 100, GOLD PRICES (XAU/USD) FORECAST:
- The Nasdaq 100 rose modestly on Tuesday, supported by falling U.S. Treasury yields
- Despite the pullback in rates, gold prices trended slightly lower during the trading session
- Attention will be on the U.S. nonfarm payrolls later in the week
Trade Smarter - Sign up for the DailyFX Newsletter
Receive timely and compelling market commentary from the DailyFX team
Most Read: US Dollar Setups - USD/JPY Gains as GBP/USD Trends Lower, AUD/USD Hammered
The Nasdaq 100 rebounded modestly on Tuesday following a subdued performance at the start of the week, supported by a significant drop in U.S. Treasury yields in the wake of unfavorable economic data. When it was all said and done, the equity index climbed 0.25%, settling above the 15,900 mark and approaching its 2023 highs.
To provide background information, bond rates fell across the board after October's U.S. job openings figures, reported in the JOLTS survey, surprised to the downside by a wide margin. The disappointing results raised fears that the once indestructible labor market is beginning to crumble under the weight of aggressive monetary policy, which, in turn, boosted Fed easing wagers for 2024.
US JOLTS DATA
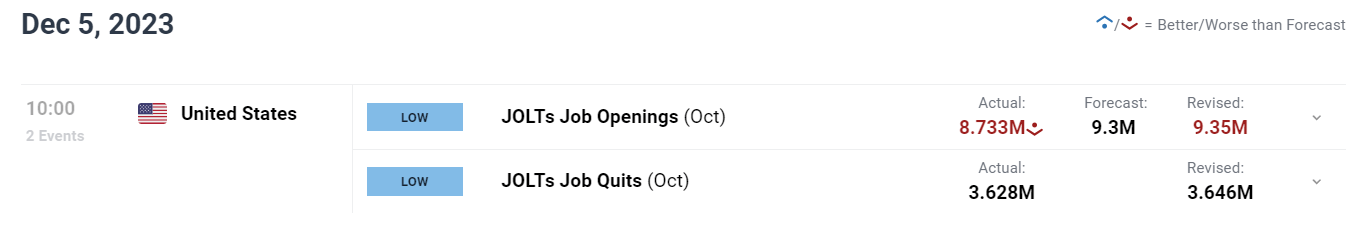
Source: DailyFX Economic Calendar
Although the pullback in yields benefited the tech index, gold struggled to leverage the situation, with prices falling for the second day in a row. While the precious metal maintains a constructive outlook, bulls are not yet ready to re-engage long positions after getting caught on the wrong side of the trade on Monday when the Asian session’s breakout quickly transformed into a large sell-off.
Looking ahead, we may see measured moves in gold and the Nasdaq 100 over the next couple of days as investors avoid making large directional bets ahead of the release of the November U.S. employment numbers on Friday. The upcoming jobs report will provide valuable insight into the health of the economy and, therefore, may help guide the Fed's next steps.
If you're looking for an in-depth analysis of U.S. equity indices, our quarterly stock market trading forecast is packed with great fundamental and technical insights. Get a free copy now!

NASDAQ 100 TECHNICAL ANALYSIS
The Nasdaq 100 dropped sharply on Monday but selling pressure abated when the tech index failed to break below support at 15,700. From those levels, prices have mounted a moderate rebound, consolidating above the 15,900 mark. If gains accelerate in the coming days, resistance is visible in the 16,080 to 16,200 band. On continued strength, the focus shifts to the all-time high near 16,800.
Conversely, if sentiment swings back in favor of sellers and prices head south, the first important floor to watch is located around 15,700. Although this region might provide stability on a retracement, a breakdown could set the stage for a drop toward trendline support at 15,500. Moving lower, the next downside target would be the 100-day simple moving average.
NASDAQ 100 TECHNICAL CHART
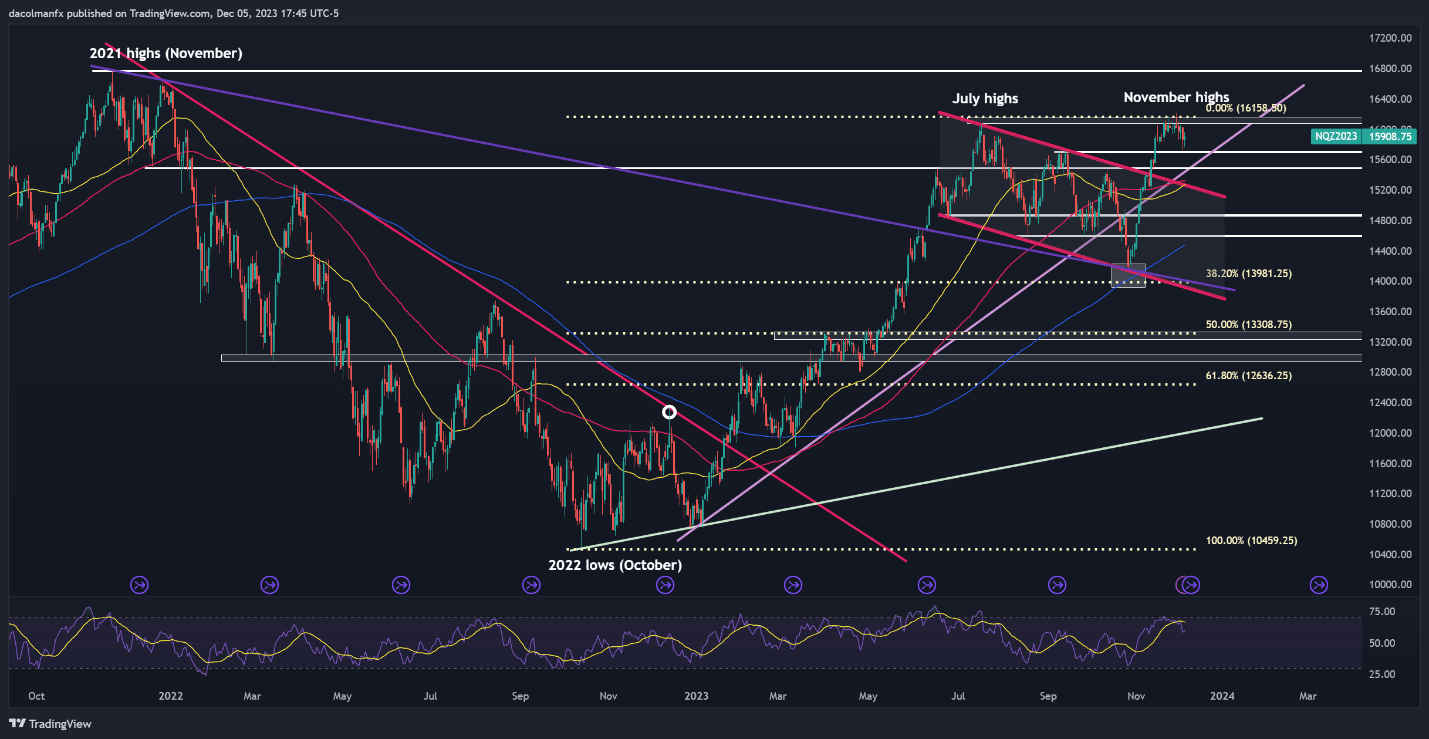
Nasdaq 100 Chart Created Using TradingView
Eager to gain insights into gold's future path? Discover the answers in our complimentary quarterly trading guide. Request a copy now!

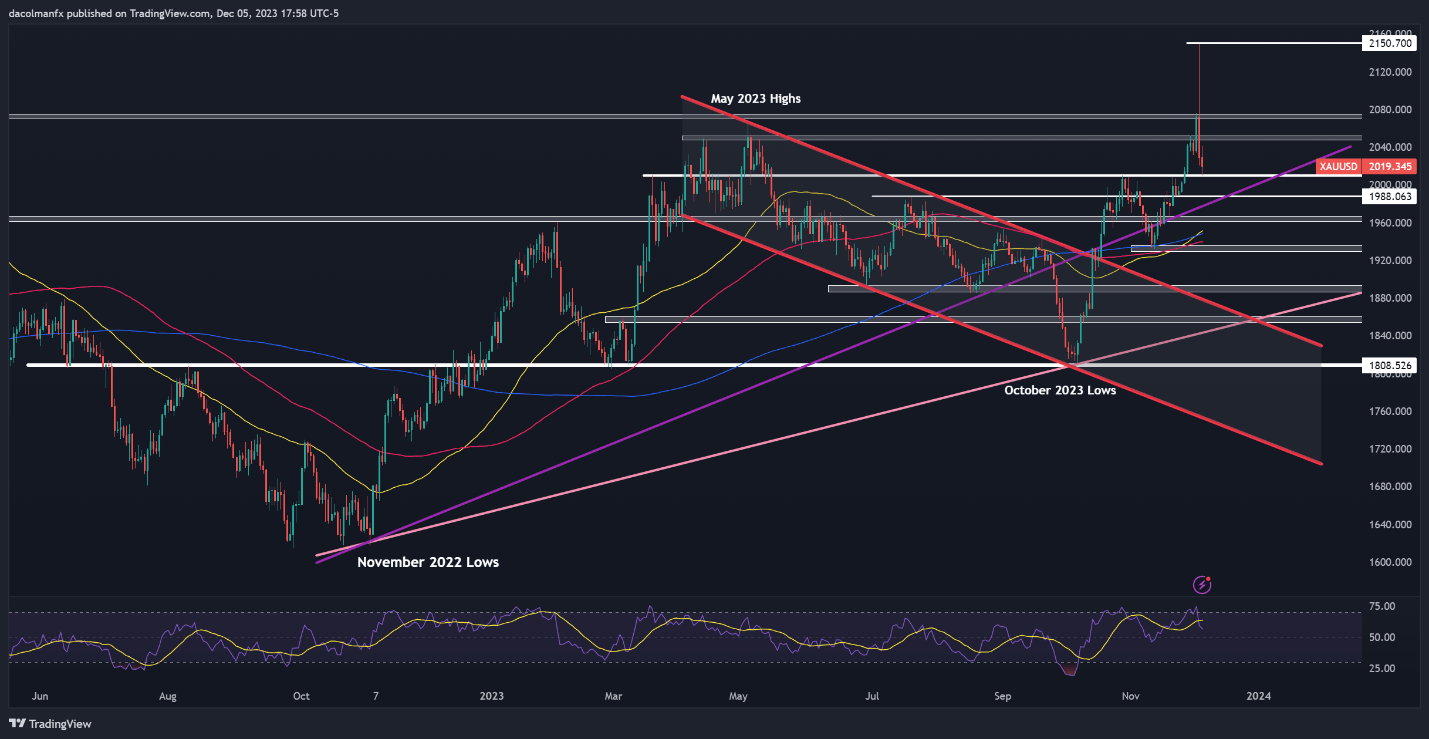
GOLD PRICES TECHNICAL ANALYSIS
Gold (XAU/USD) surpassed its previous record and briefly hit a fresh all-time high on Monday, but was quickly slammed lower, signaling that the long-awaited bullish breakout was nothing more than a fakeout.
Although the bulls may have thrown in the towel for now, bullion retains a constructive technical outlook. This means that the path of least resistance remains to the upside. That said, if the precious metal resumes its advance, the first barrier to watch looms at $2,050, and $2,070/$2,075 thereafter. Beyond this zone, attention turns to $2,150.
On the flip side, if losses intensify in the near term, initial support is positioned around $2,010. This area could act as a floor in case of additional losses, but a drop below it may be a signal that a deeper pullback is in gestation, with the next downside target situated near $1,990.
GOLD PRICE TECHNICAL CHART