FORECAST – GOLD, EUR/USD, NASDAQ 100
- Gold prices retreat after failing to sustain Monday’s brief bullish breakout
- The Nasdaq 100 also loses ground, dragged lower by the rebound in U.S. Treasury yields
- EUR/USD slides but finds support around its 200-day simple moving average
Trade Smarter - Sign up for the DailyFX Newsletter
Receive timely and compelling market commentary from the DailyFX team
Most Read: US Dollar Flies as US Yields Spring Back to Life, Setups on USD/JPY, AUD/USD
Gold prices soared early Monday during the Asian session, hitting a fresh record just shy of $2,150. However, this bullish explosion swiftly transformed into a substantial sell-off when European and U.S. markets came online, with the reversal likely attributed to the rebound in bond rates.
U.S. Treasury yields have been trending lower since late November on the assumption that the Fed would move to cut borrowing costs in 2024, but perked up at the start of the new week as traders began to unwind bets of excessive monetary easing, which seemed a little inconsistent with the current economic reality.
The rally in rates boosted the U.S. dollar across the board, weighing on precious metals and risk assets. In this context, the Nasdaq 100 dropped nearly 1%, though it finished the day off its worst levels after ricocheting off support at 15,700. EUR/USD also fell but managed to hold above its 200-day simple moving average.
In this article, we examine the technical outlook for gold, EUR/USD and the Nasdaq 100, taking into account price action dynamics and critical levels that could come into play ahead of key high-impact events in the coming days.
Eager to gain insights into gold's future trajectory and the upcoming drivers for volatility? Discover the answers in our complimentary quarterly forecast. Get your free copy now!

GOLD PRICES TECHNICAL ANALYSIS
Gold took out its all-time high and hit a fresh record on Monday, but was quickly slammed lower, signaling that the breakout was possibly a fakeout.
Despite the 180-degree market reversal, the yellow metal maintains a constructive bias, for which the path of least resistance remains to the upside. With this in mind, if prices resume their advance, the first barrier to watch appears at $2,050, followed by $2,070/$2,075. On further strength, attention shifts to $2,150.
Conversely, if losses gain impetus in the days ahead, initial support can be spotted around $2,010. This area could act as a floor in the event of extended weakness, but a drop below it could indicate a deeper pullback in the offing, with the next downside target located at $1,990.
GOLD PRICE TECHNICAL CHART
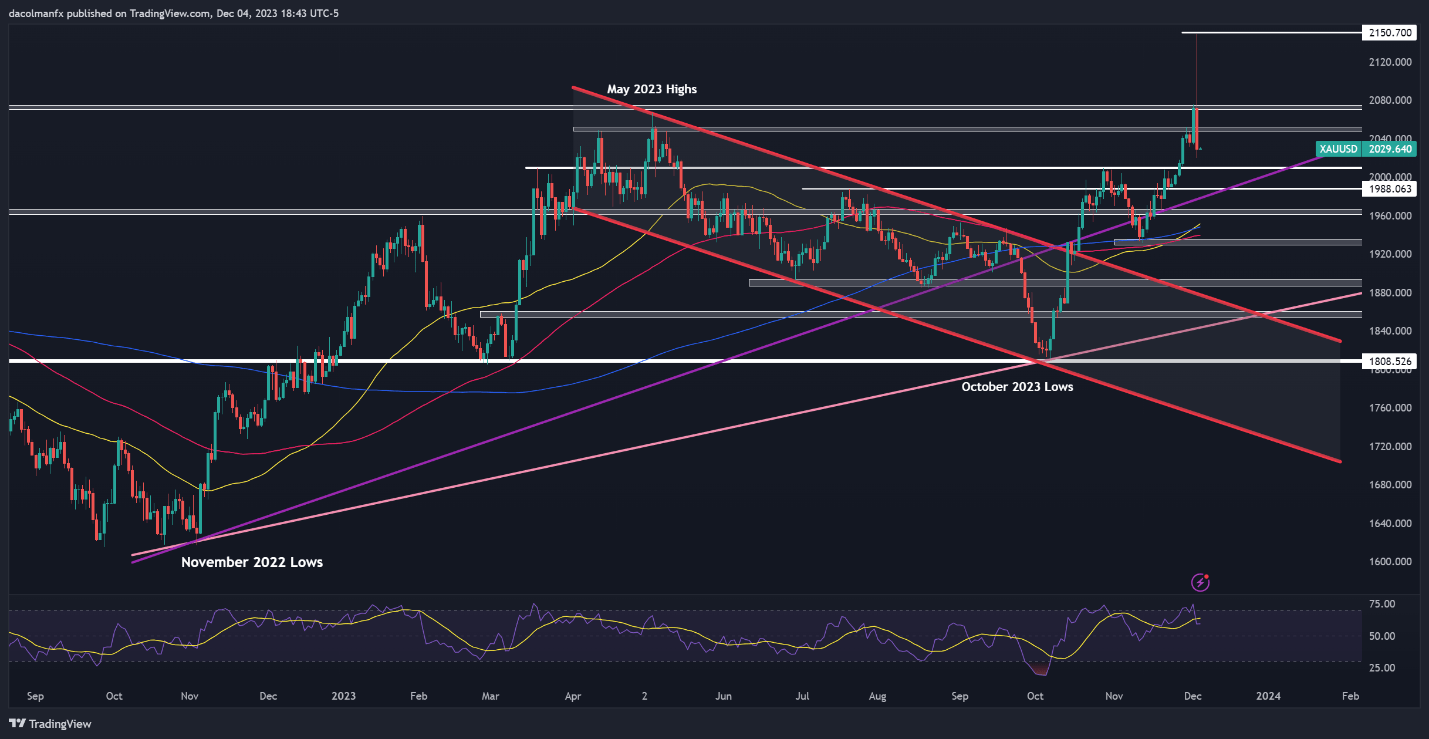
Gold Price Chart Created Using TradingView
Stay ahead of the curve! Request your complimentary EUR/USD trading forecast for a thorough overview of the pair’s technical and fundamental outlook

EUR/USD TECHNICAL ANALYSIS
EUR/USD rallied vigorously in November, but has started to retrace some of that advance in recent days, with bearish pressure easing as prices tested the 200-day simple moving average. It is important for bulls to defend this technical indicator, which currently symbolizes support; a failure to do so could result in a decline toward 1.0765, followed by 1.0650.
On the flip side, if the common currency regains the upper hand against the greenback and stages a meaningful comeback, technical resistance looms at 1.0960 – the 61.8% Fibonacci retracement of the July/October decline. Sustained strength could lead to revisiting November's peak, followed by a move towards horizontal resistance at 1.1080 upon a breakout.
EUR/USD TECHNICAL CHART
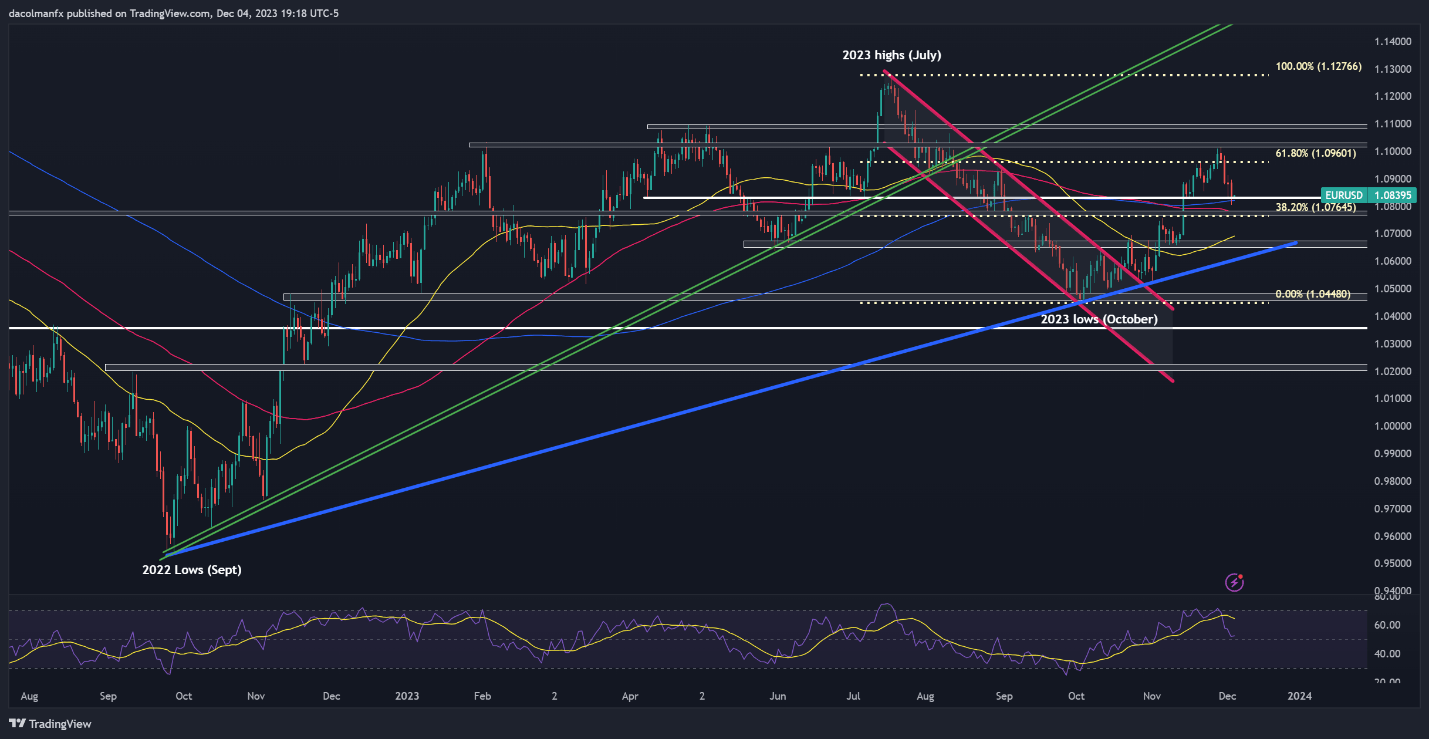
EUR/USD Chart Created Using TradingView

NASDAQ 100 TECHNICAL ANALYSIS
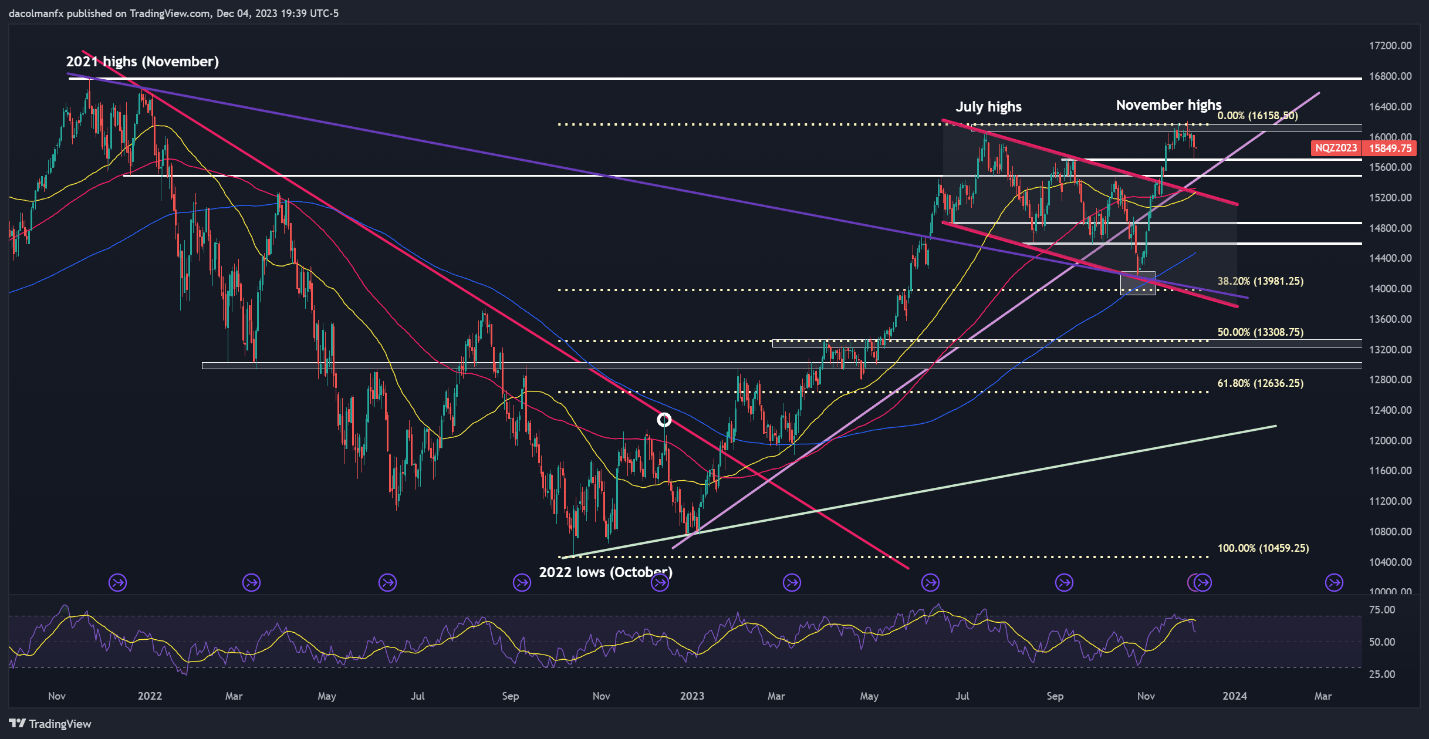
The Nasdaq 100 soared in November, rising more than 10% and posting its largest monthly gain since July 2022. Despite this strong rally, upward momentum has faded, with the tech index slipping below the 16,000 level in recent days.
While the Nasdaq 100 retains a constructive bias over a medium-term horizon, the near-term outlook could flip to mildly bearish if technical support at 15,700 caves in. Should this scenario play out, we could see a drop toward 15,500. Although this region might provide stability on a retracement, breaching it could expose the 100-day simple moving average near 15,325.
On the other hand, if sentiment swings back in favor of buyers, resistance is visible in the 16,080 to 16,200 band. Clearing this ceiling might pose a challenge for the bullish camp, but a breakout could ignite strong buying interest driven by FOMO mentality, paving the way for a retest of the all-time high.
NASDAQ 100 TECHNICAL CHART