GOLD PRICE, NASDAQ 100 OUTLOOK
- The Nasdaq 100 and gold prices have rallied in tandem this month, an unusual occurrence given their tendency to move in opposite directions
- Current market dynamics are becoming more positive for risk assets and precious metals alike
- This article looks at the technical outlook for gold and the Nasdaq 100, examining the key price levels worth keeping an eye on in the coming days
Trade Smarter - Sign up for the DailyFX Newsletter
Receive timely and compelling market commentary from the DailyFX team
Most Read: US Dollar in Tailspin, Price Action Setups on EUR/USD, GBP/USD and AUD/USD
The Nasdaq 100 and gold will typically move in opposite direction given their inherent nature and characteristics: the tech equity index is perceived as a risk-on investment, while the precious metal is regarded as a defensive play. At times, however, both bullion and stocks will show a positive correlation if underlying market conditions temporarily align in their favor. This appears to be the current situation.
For context, the Nasdaq 100 and gold prices have risen sharply in November, with the former surging nearly 11% and the latter rising around 3.80% since the beginning of the month. Their rally has been underpinned by falling U.S. Treasury yields and a dovish repricing of interest rate expectations, on the assumption that the Fed has finished its tightening campaign and will move into an easing cycle in 2024.
While policymakers have attempted to keep the door open to additional hikes and pushed back against rate cut bets earlier this year, recent communication has taken a turn toward a slightly more dovish tone. Today for example, Fed Governor Christopher Waller, typically a hawkish voice, stated that he is "increasingly confident" that monetary policy is in the right place and that, if inflation continues to slow, rate cuts could be considered.
The softer rhetoric may be a sign that the central bank is slowly preparing for a change in strategy, which could come in early 2024.
We'll have more clues about the monetary policy outlook in the coming weeks when the FOMC holds its December meeting, so for now it's important to keep a close eye on Fedspeak, especially Chairman Powell's speech on Friday. Anything resembling a pivot would likely put further pressure on bond yields, giving the Nasdaq 100 and gold room to rally further heading into the end of the year.
If you're looking for an in-depth analysis of U.S. equity indices, our Q4 stock market trading forecast is packed with great fundamental and technical insights. Get a free copy now!

NASDAQ 100 TECHNICAL ANALYSIS
The Nasdaq 100 tested its July high last week and briefly breached it, but has been unable to closed past the 16,100 mark, with sellers defending this ceiling tooth and nail so far. With sentiment on the mend and market dynamics more positive, however, a bullish breakout could be just around the corner, meaning more gains could materialize heading into December.
In the event of a breakout and a decisive move above the 16,100 zone, upward momentum could accelerate, setting the stage for a rally towards the 2021 highs just below 16,800. On further strength, the tech index could be headed for fresh records. Conversely, if prices reverse lower from current levels, initial support appears at 15,700, followed by 15,500.
NASDAQ 100 TECHNICAL CHART
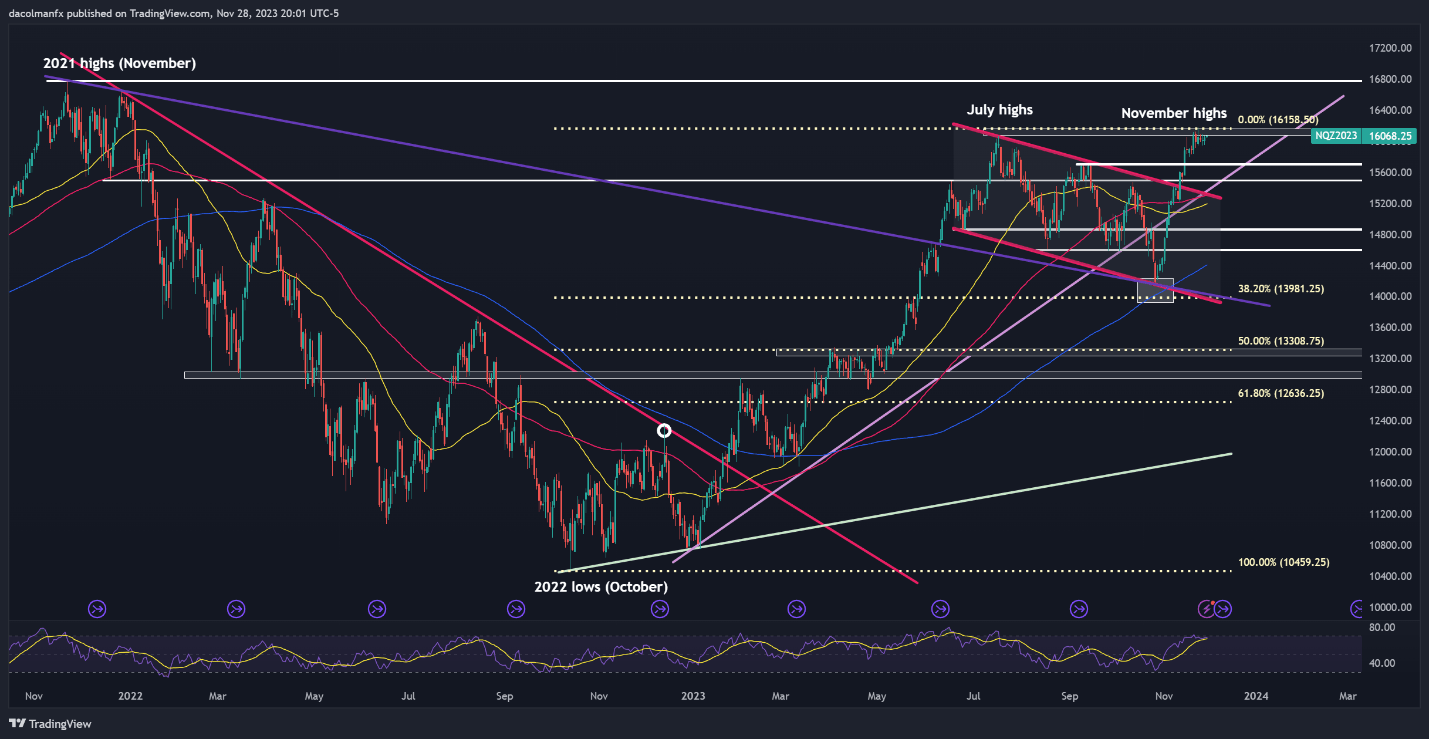
Nasdaq 100 Chart Created Using TradingView
Eager to gain insights into gold's future trajectory and the upcoming market drivers for volatility? Discover the answers in our complimentary Q4 trading guide.

GOLD PRICE TECHNICAL ANALYSIS
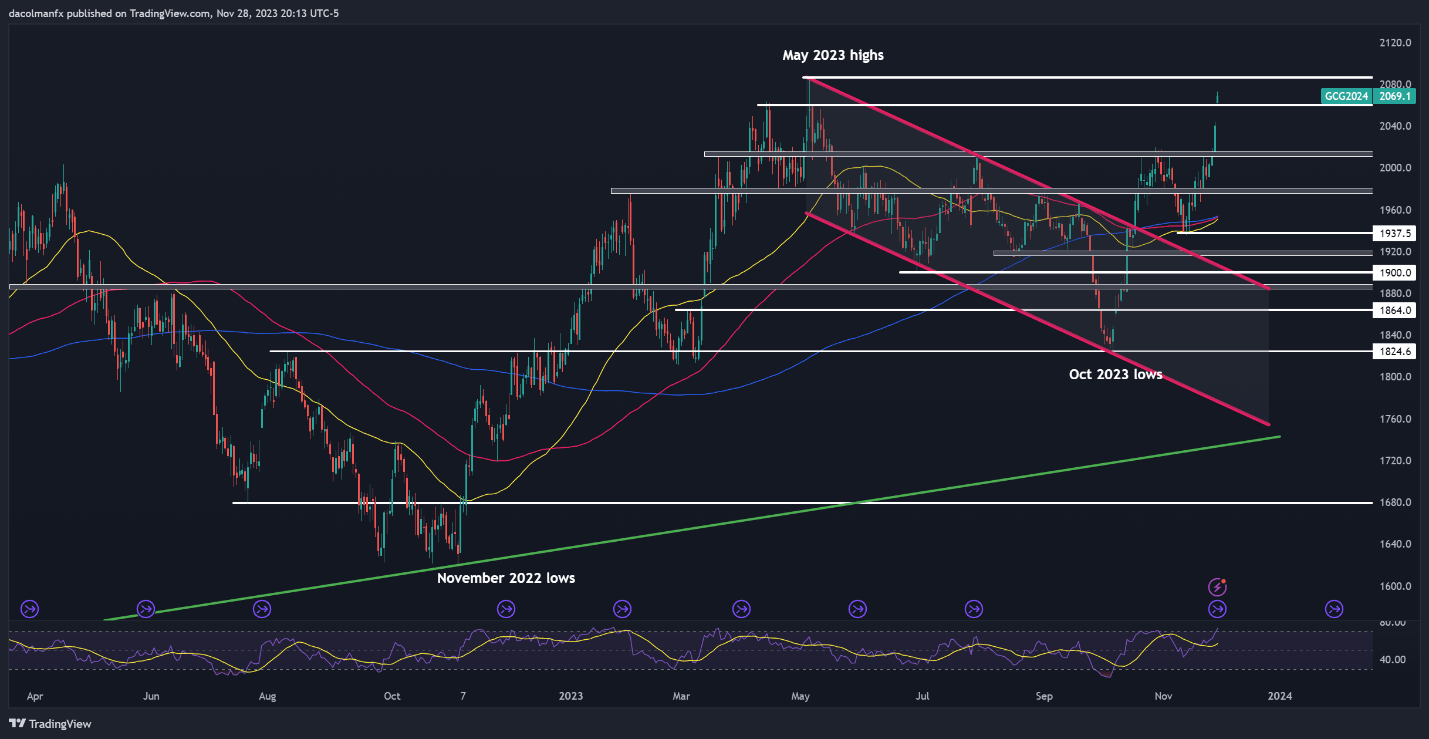
Gold prices have rallied aggressively in recent days, blasting past multiple resistance thresholds, including $2,015 and $2,060. With bullish momentum on its side, a retest of May’s peak could come in the coming trading sessions. Successfully piloting above this ceiling could open the door for a move towards new highs above $2,100.
On the other hand, if upward impetus wanes and XAU/USD pivots lower, support is located at $2,060, and $2,015/$2,010 thereafter. Prices might find stability in this zone during a pullback, but a clean breakdown could trigger a decline towards $1,980/$1,975. Further losses hereon out might redirect attention towards the 200-day simple moving average.
GOLD PRICE TECHNICAL CHART