


Article by IG Chief Market Analyst Chris Beauchamp
Nasdaq 100, Dow Jones, Nikkei 225 Analysis and Charts
Nasdaq 100 at one-month low
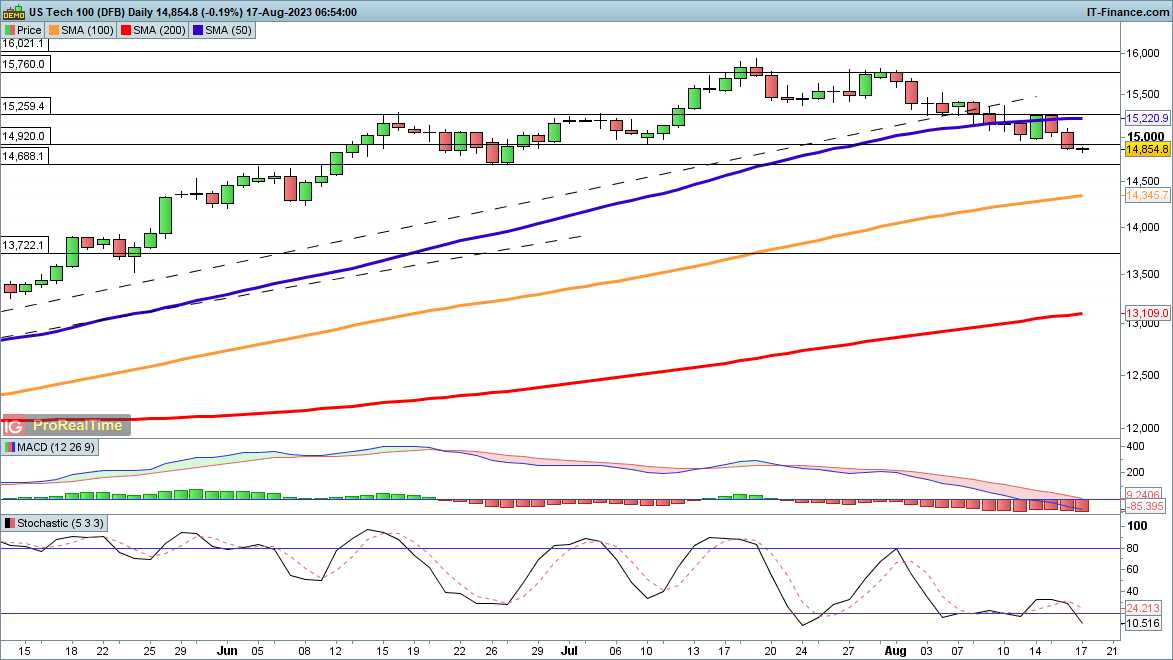
The pullback continues here, with no sign of a low being formed as yet. Having fallen below support at 14,920, the price now targets the June low at 14,688. So far this retracement in a broader uptrend has been relatively controlled, but further losses could see the 100-day SMA tested next.
For the moment, bulls will need a close above 15,000 to suggest that a near-term low may be forming.
Nasdaq 100 Daily Chart

Dow falls back towards 50-day SMA
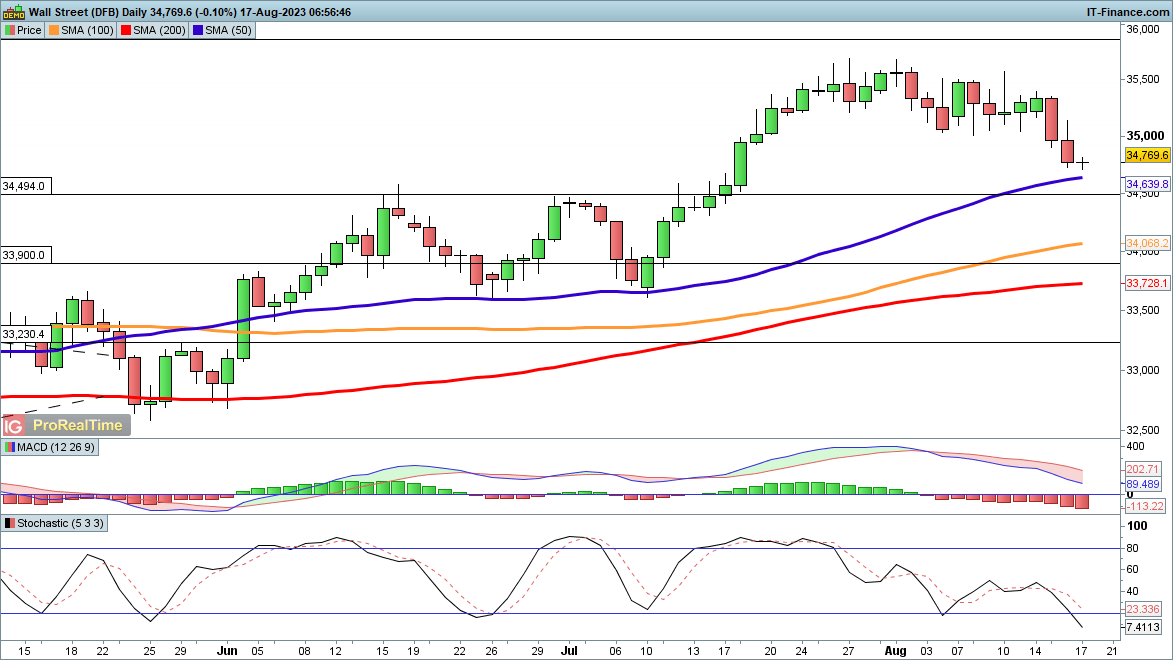
The index finally began to move more noticeably to the downside in the past two sessions, and is now nearing the 50-day SMA.Weakness back in June and July found support just above the 50-day SMA, and this might prove to be the case this time around. Having dropped below 35,000, buyers will want to see a close back above this level to form a short-term low.
Below the 50-day SMA the next target would be the June highs around 34,494, while beyond this looms the 100-day SMA and then 33,900.
Dow Jones Daily Chart
See How Daily and Weekly Changes in Retail Holdings Affect Sentiment
| Change in | Longs | Shorts | OI |
| Daily | -11% | 0% | -3% |
| Weekly | -27% | 21% | 4% |
Nikkei 225 rallies off the lows
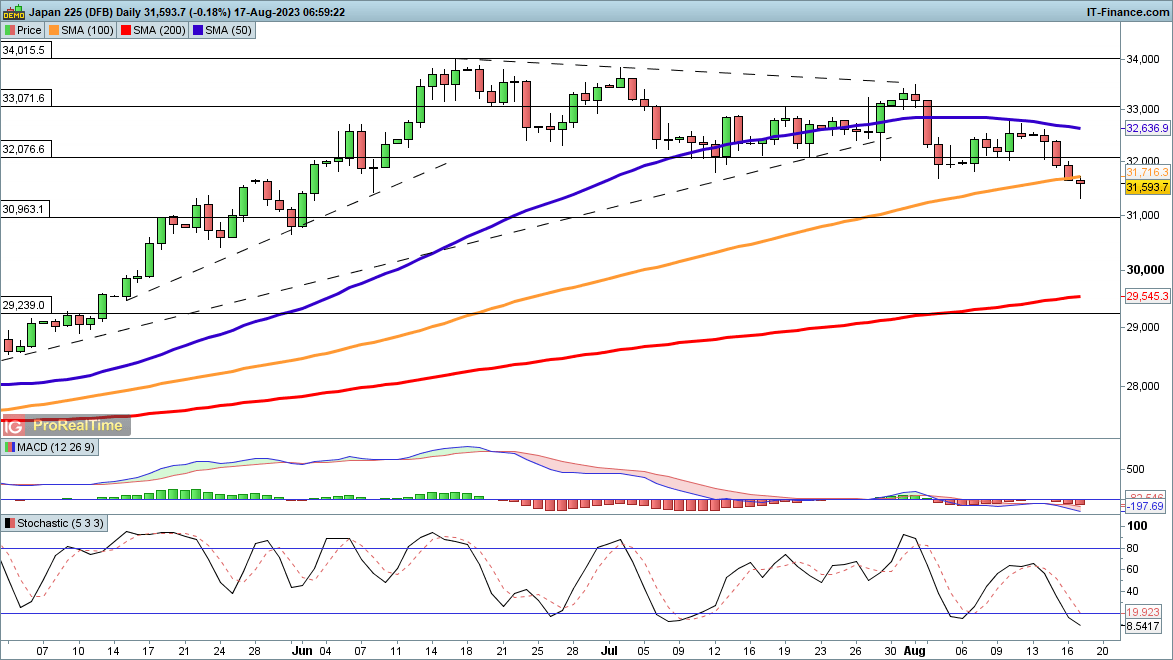
The long retracement from the June high goes on, with no sign yet of a rebound. The index has slipped below the 100-day SMA for the first time since March, a measure of how far it has rallied in that time. It may find some intermediate support around 30,963, but below this, the next major level would be the 200-day SMA.
A close back above 32,000 would help to put the index back on the front foot in the short term, helping to put in place the initial foundations of a broader recovery.
Nikkei 225 Daily Chart
Introduction to Technical Analysis
Moving Averages
Recommended by IG


