


GOLD, SILVER AND OIL FORECAST:
GOLD, SILVER FORECAST: NEUTRAL
- Gold Still Faces Downside Risk Until We Have Sustained Acceptance Above the $2000 Handle.
- Silver Has Broken Above the Descending Trendline and Eyes Further Gains.
- Postponed OPEC+ Meeting Will be Key to a Potential Recovery in Oil Prices.
- To Learn More About Price Action,Chart PatternsandMoving Averages, Check out theDailyFX Education Series.
READ MORE: Bitcoin Steady as Coinbase (Coin) Emerges as Winner from Binance Saga
Gold and Silver prices enjoyed a positive week as buyers kept both metals supported with a struggling US Dollar helping as well. Both Gold and Silver threatened a selloff this week, but buyers kept prices steady for the majority of what was a shortened trading week. Looking at Gold though and the failure to find acceptance above the $2000/oz mark could leave the precious metal vulnerable heading into next week.

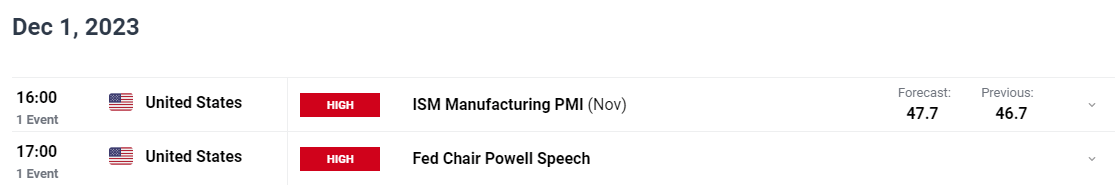
ISM DATA AND CORE PCE HOLD THE KEY
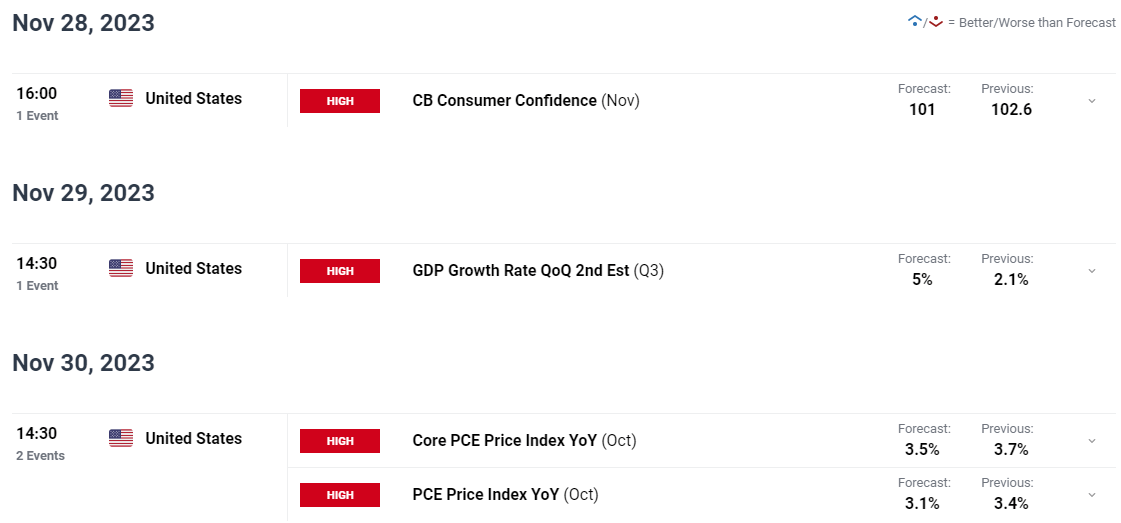
As the Middle East enters a long-awaited cooling off period US data is likely to be the key driver for Gold, at least in the early part of the week. Next week will be a busier one with no Holiday interference ad a host of both high and medium impact data releases.
The key events that could stoke volatility in the US Dollar and thus in Gold prices are likely to be the ISM data and of course the Feds preferred gauge of inflation, the Core PCE data. Markets have bought in to the idea of rate cuts in 2024 with around 90bps currently priced in. Personally, I have mixed feelings on what to expect yet given that I do believe demand will face constraints as consumers feel the heat but I would prefer to see some signs that the job market is cooling.
I expect short bursts of buying and selling following data releases to continue in the week ahead but neither release I expect will change the overall outlook. We still have the December NFP release and FOMC meeting as well as inflation data before the year is out. So we could be in for continuous shifting of market expectations regarding Fed rate hikes until the Fed announce an end to the hiking cycle. This could leave Gold prices throwing mixed signals as we have seen of late, and we may not get acceptance above the $2000/oz mark before the year is up.
For all market-moving economic releases and events, see the DailyFX Calendar
Trade Smarter - Sign up for the DailyFX Newsletter
Receive timely and compelling market commentary from the DailyFX team
TECHNICAL OUTLOOK GOLD AND SILVER
Looking at the technical perspective and Gold is looking to close above the $2000/oz mark. However as discussed already a close above may not last long as has been the case of late.
Gold prices would first need to clear immediate resistance at the October high around the $2009/oz mark. This would be the first step toward acceptance above the $2000 mark, otherwise we could be in for a deeper retracement.
Key areas of support to pay attention to come in around 1990.00, 1980.00 and 1968.00, may all provide support before this past week’s low print around 1931.65 comes into play.
Gold (XAU/USD) Daily Chart – November 24, 2023
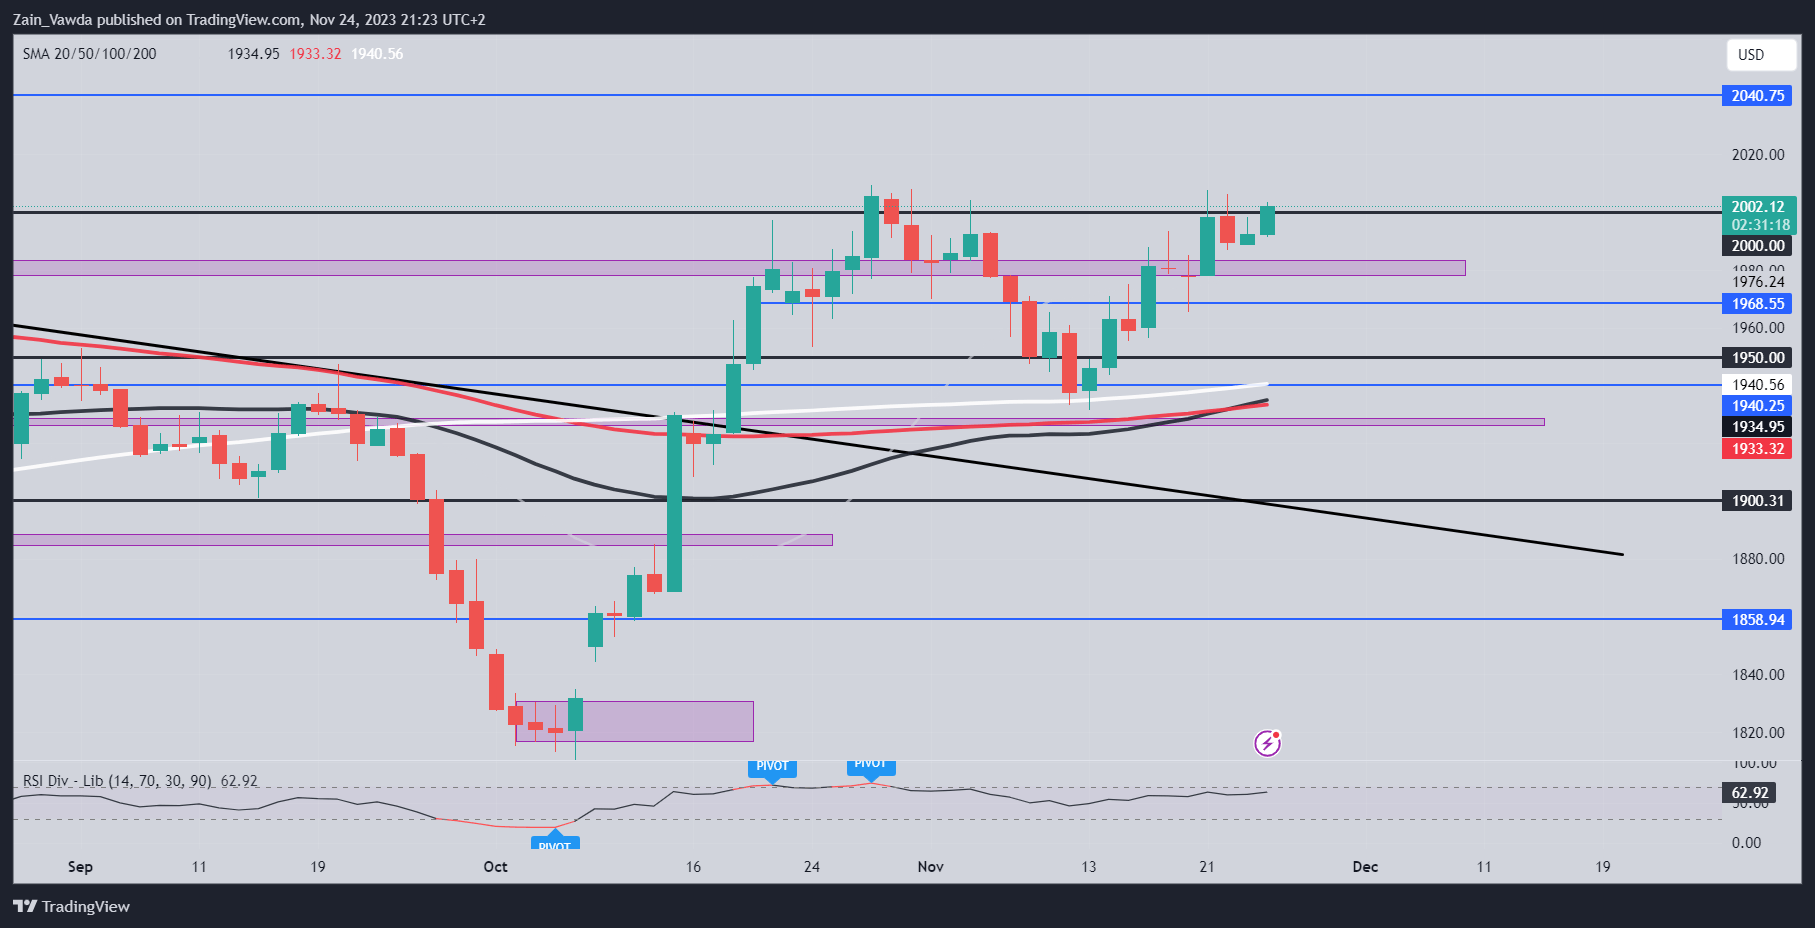
Source: TradingView
Silver (XAG/USD)
Silver prices are a bit more clear to decipher following a breakout of the long-term descending trendline and resting at a key resistance area (24.30) at the time of writing. Friday brought a very bullish day for silver following indecision for the majority of the week.
Heading into next week, Friday’s daily candle close will be important. If the daily candle closes above the resistance level at 24.32 then a push on toward resistance at 24.97 may occur in the early part of the week. Alternatively, if we fail to close above 24.32 then a retracement to retest the trendline before potentially continuing higher. The fact that we have printed a higher high as well may lead to a retracement before continuing higher.
Key Levels to Keep an Eye On:
Resistance Levels
- 24.32
- 24.97
- 26.00
Support Levels
- 23.80
- 23.23
- 22.76
Silver (XAG/USD) Daily Chart – November 24, 2023
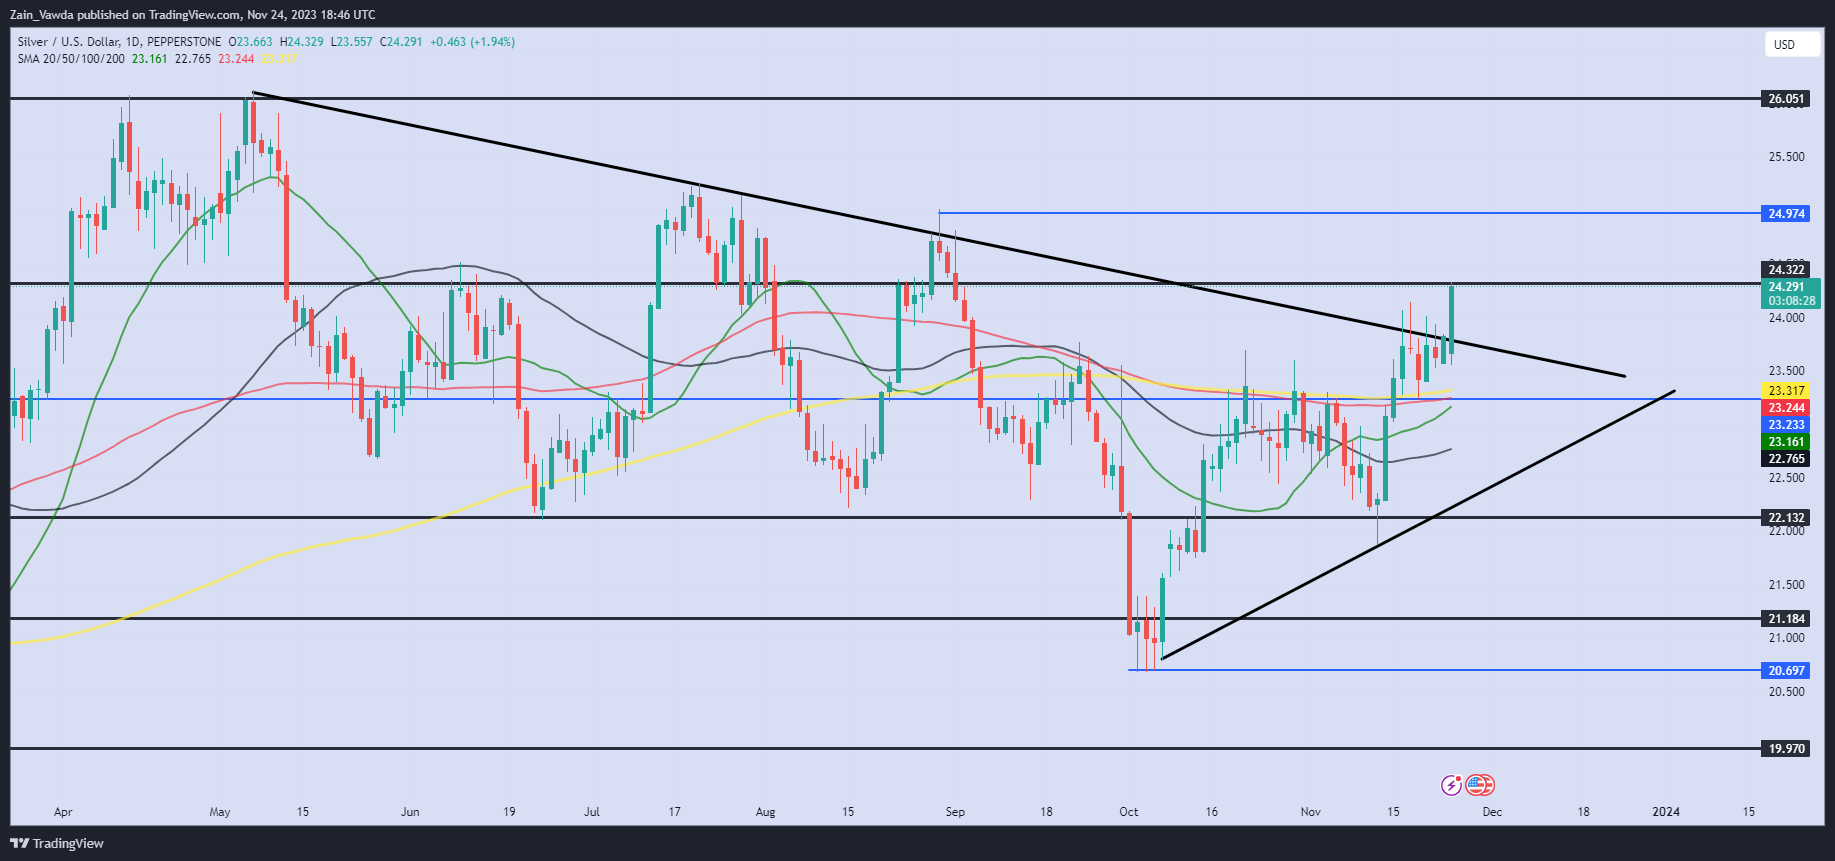
Source: TradingView
OIL OUTLOOK
Oil prices have had an intriguing week fluctuating quite a bit. Oil looked set for a recovery following a bullish move on Monday and Tuesday before news around the OPEC+ meeting sent markets into a brief panic. OPEC+ announced a delay to the meeting as rumors grew that countries were at loggerheads regarding the output numbers for 2024.
African producers in particular seemed to be at loggerheads with other members which seems a waste of energy. The reason I say this, should demand drop as expected and if output isn’t cut, Oil prices will drop as stockpiles rise. However, Friday brought news that OPEC+ are moving closer to a compromise with African Oil producers as Angola and Nigeria who had hoped for higher output seem to be coming around.
This will obviously add an extra layer on intrigue to the upcoming meeting which has been pushed to November 30. The meeting is expected to be held virtually with sources claiming 99% certainty that a deal will be reached. This will be the biggest risk to Oil prices for the week ahead and could provide a catalyst for a sustained recovery.
WTI Oil Daily Chart – November 24, 2023
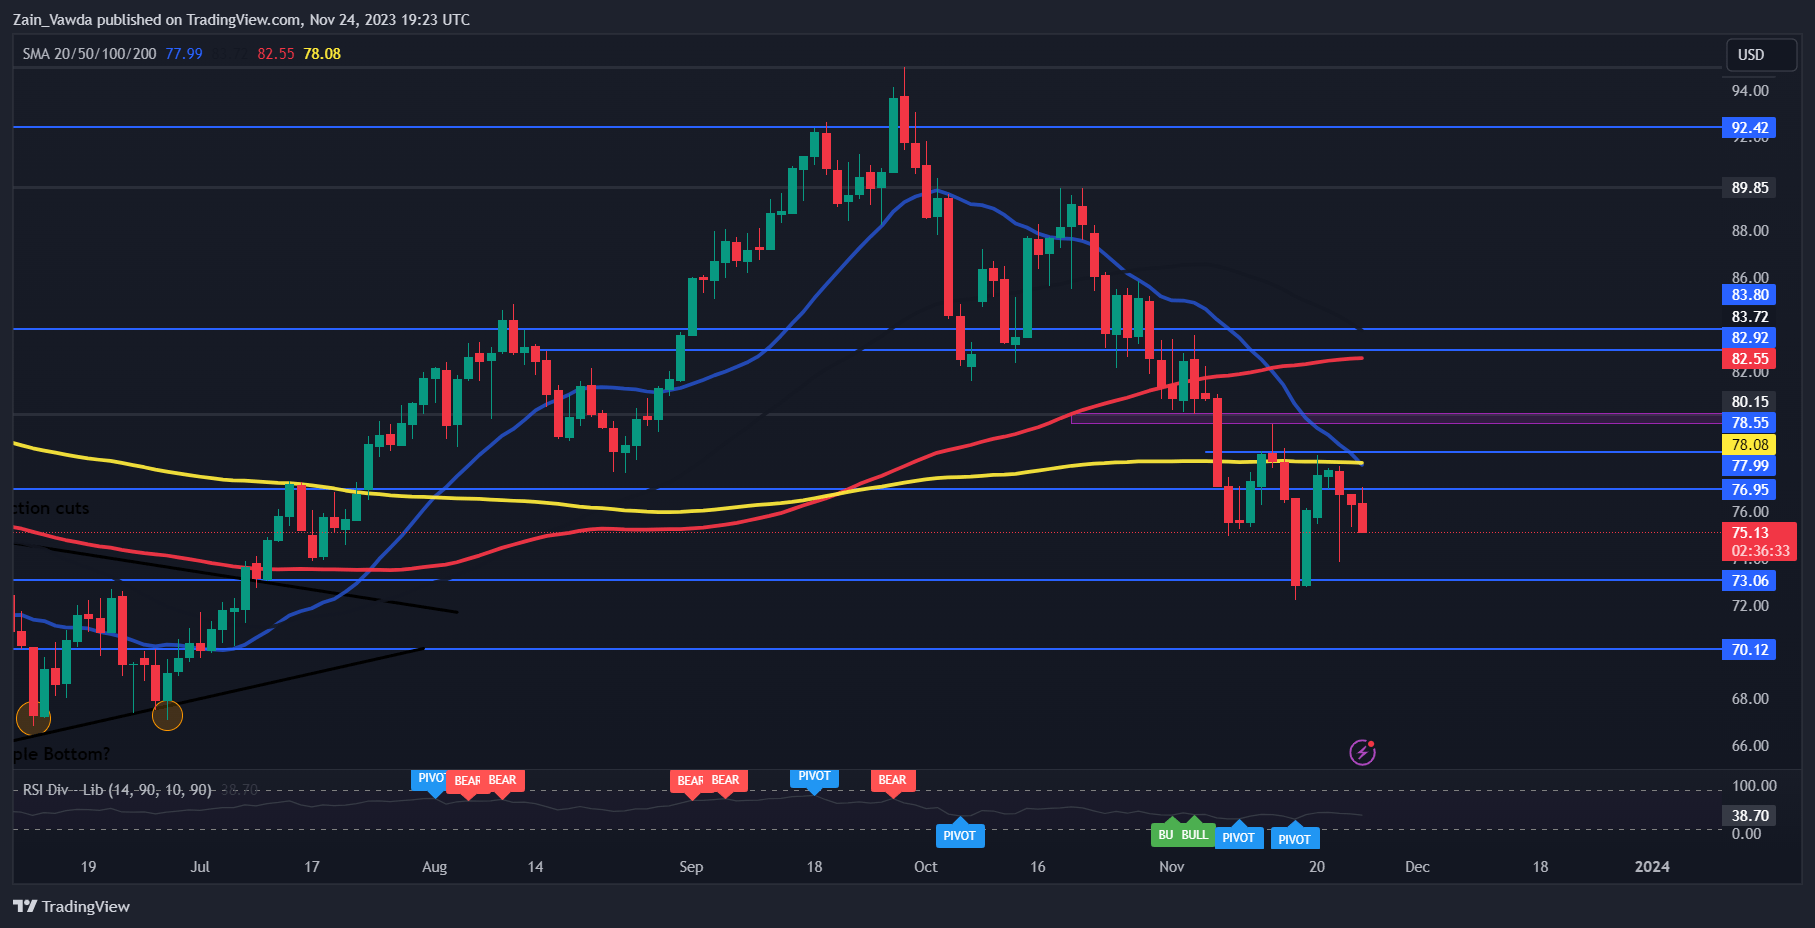
Source: TradingView
Looking at price action and we remain bearish printing lower highs and lower lows. Price rejected of the 200-day MA and eyeing the recent lows at around the $73 a barrel mark. Below that support rests at 71.50 before the psychological 70.00 mark comes into focus. The downside does appear to have the momentum from a technical perspective as we do have a death cross playing out with the 20-day MA crossing below the 200-day MA. This obviously bodes well for further downside.
Looking at the potential for a move higher and the first area of interest will be the 200-day MA and swing high around the 78.00 mark. A daily candle close above this level is needed if we are to see a change in structure and signal bullish price action. Above the 78.00 handle, resistance rests at the 80.00 mark.
For Tips and Tricks to Using IG Client Sentiment Data, Download the Free Guide Below.
| Change in | Longs | Shorts | OI |
| Daily | -9% | 13% | -2% |
| Weekly | -17% | 27% | -5% |
Written by: Zain Vawda, Market Writer for DailyFX.com
Contact and follow Zain on Twitter: @zvawda


