


Gold (XAU/USD) Price, Analysis and Chart
- The latest US inflation will steer gold going into 2024.
- Gold continues to test resistance, 20-dsma acting as near-term support.
Learn How to Trade Gold with our Complimentary Guide

The technical outlook for gold is looking increasingly positive as we near the last major data event of 2023, the Fed’s preferred measure of inflation, Core PCE. This Friday’s release is expected to show the November Core PCE Price Index (y/y) slip to 3.3% from 3.5% in October, while the PCE Price Index (y/y) is expected at 2.8% from a prior month’s 3.0%. If these market forecasts are correct, the Fed will have a tougher job trying to convince financial markets that US rates need to stay at their current level for much longer.
US Dollar (DXY) Latest: Markets Ignore Fed Rate Pushback, GBP/USD and EUR/USD
For all economic data releases and events see the DailyFX Economic Calendar
Gold is currently changing hands around $2,036/oz. in what looks to be limited trade. The 20-day simple moving average is providing near-term support and the precious metal is probing an old level of resistance at $2,043/oz. and two recent highs on either side of $2,048/oz. A break higher opens the way to $2,070/oz. and then $2,081/oz. To push higher, gold is going to need a strong driver – maybe Friday’s PCE release – otherwise the precious metal will likely trade sideways going into the festive break. A break below the 20-dsma ($2,023/oz.) would leave $2,009/oz. vulnerable.
Gold Daily Price Chart
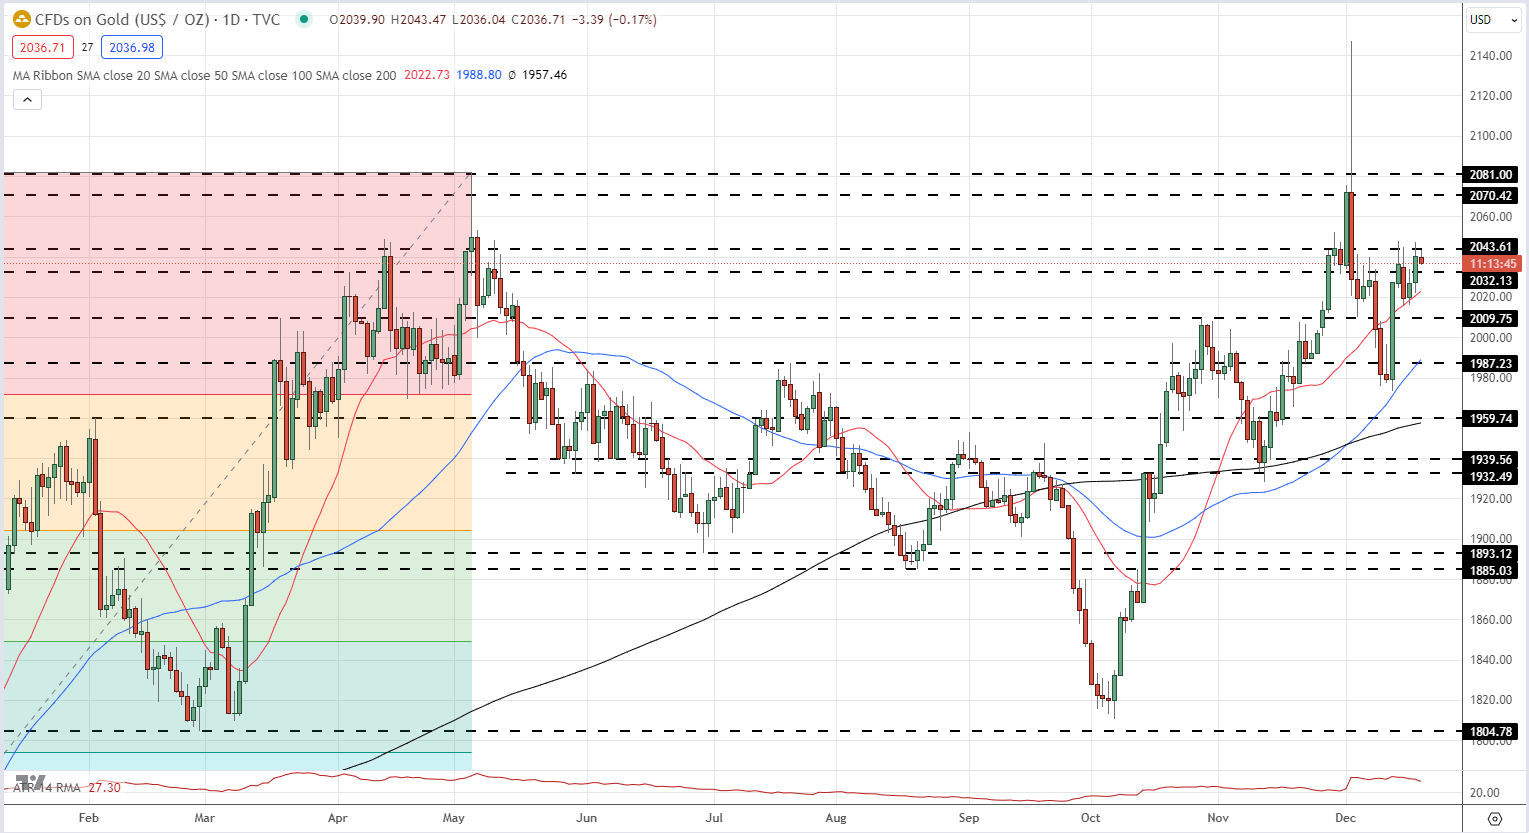
Chart via TradingView
Retail trader data shows 61.66% of traders are net-long with the ratio of traders long to short at 1.61 to 1.The number of traders net-long is 1.22% higher than yesterday and 4.56% higher than last week, while the number of traders net-short is 6.11% higher than yesterday and 6.83% higher than last week.
We typically take a contrarian view to crowd sentiment, and the fact traders are net-long suggests Gold prices may continue to fall.
See how changes in IG Retail Trader data can affect sentiment and price action.
| Change in | Longs | Shorts | OI |
| Daily | -9% | 6% | -3% |
| Weekly | -2% | -6% | -4% |
Charts via TradingView
What is your view on Gold – bullish or bearish?? You can let us know via the form at the end of this piece or you can contact the author via Twitter @nickcawley1.


