
Most Read: Japanese Yen Sentiment Analysis & Outlook – USD/JPY, EUR/JPY, GBP/JPY
Gold prices plummeted on Thursday following stronger-than-expected U.S. economic data, which drove U.S. Treasury yields higher and boosted the U.S. dollar against most currencies. When it was all said and done, the precious metal fell over 2% after a volatile session, breaking through several support levels and hitting its lowest point in two weeks.
With the U.S. economy performing exceptionally well and inflationary pressures proving more persistent than anticipated, the Federal Reserve is likely to maintain its restrictive policy stance for longer. This scenario of higher interest rates for longer could limit gold's upside potential in the near term, assuming risk aversion remains in check.
Eager to gain insights into gold's future path? Discover the answers in our complimentary quarterly trading guide. Request a copy now!

Looking ahead, the economic calendar will be relatively quiet until late next week when the next core PCE indicator, the Fed’s preferred inflation measure, is released. Traders should closely monitor this piece of data for insights into consumer price trends, keeping in mind that a hot report could send interest rate expectations in a hawkish direction, weighing on precious metals.
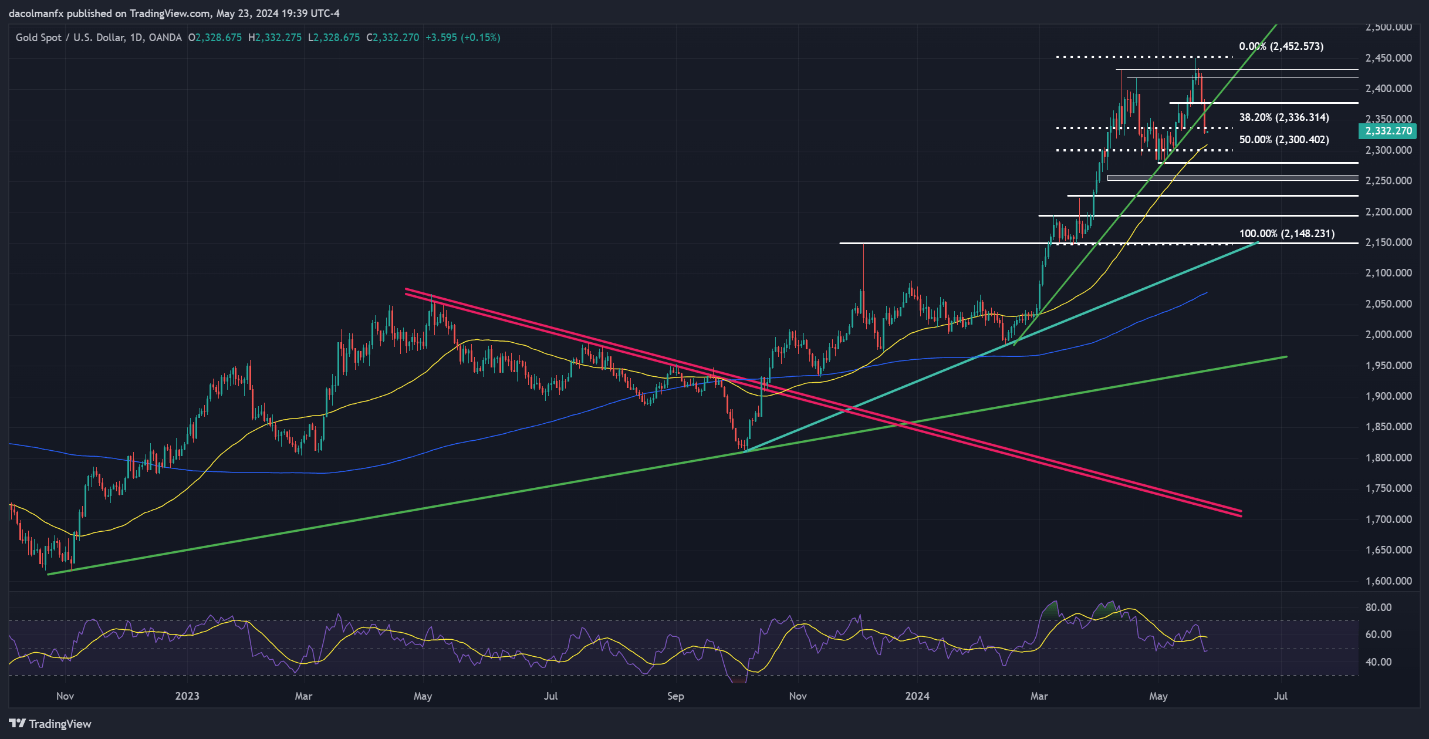
In terms of technical analysis, XAU/USD retreated for the third straight session on Thursday, breaching an important trendline at $2,360 and the 38.2% Fibonacci retracement of the 2023 rally at $2,335. If losses accelerate in the coming days, the 50-day simple moving average at $2,310 will be the next line of defense against a bearish assault, followed by $2,300 and $2,280 thereafter.
In the event of a bullish turnaround, overhead resistance emerges at $2,365, followed by $2,375. Overcoming these technical barriers could be difficult, but a successful breakout could embolden buyers to initiate an attack on $2,420. On further strength, we cannot rule out a rally towards $2430, ahead of a possible retest of the all-time high around $2450.
Wondering how retail positioning can shape gold prices? Our sentiment guide provides the answers you are looking for—don't miss out, get the guide now!
| Change in | Longs | Shorts | OI |
| Daily | -11% | 13% | -2% |
| Weekly | -16% | 30% | -2% |
GOLD PRICE TECHNICAL CHART