


Gold (XAU/USD) News and Analysis
- Jordan cancels Biden meeting after a hospital was bombed in Gaza
- Rising treasury yields after strong US retail sales data fails to contain gold prices
- Silver on the rise but gains may be hard to come by ahead of resistance
- The analysis in this article makes use of chart patterns and key support and resistance levels. For more information visit our comprehensive education library

Jordan Cancels Biden Talks and US Treasury Yields Unable to Reign in Gold
Jordan officials called off the planned meeting which was to include the Palestinian, Egyptian and Jordanian heads of state. Biden’s visit aimed to stabilize flaring tensions in the region but the latest strike on a civilian hospital has soured already fragile relations, sending gold higher.
The precious metal had already risen by around $63 on Friday as a ground offensive was being priced in. Gold prices have since then consolidated around the spike higher and the widely monitored 200-day simple moving average.
Today’s advance may be crucial for the remainder of the week as price action bounces off the prior trendline resistance (now acting as support), crosses the 200 DMA and would need to be monitored for a potential close above $1937 – the underside of the May-June consolidation pattern that has served as a pivot point thereafter.
The MACD indicator confirms bullish momentum while the RSI places gold at risk of soon rising into overbought territory. With US treasury yields nearing yearly highs on the back of strong US retail sales data, gold prices are primarily being driven by developments in the Middle East and less so by US bond yields and, by extension, the US dollar. Support appears at the 200 DMA followed by the descending trendline around $1915.
Gold (XAU/USD) Daily Chart
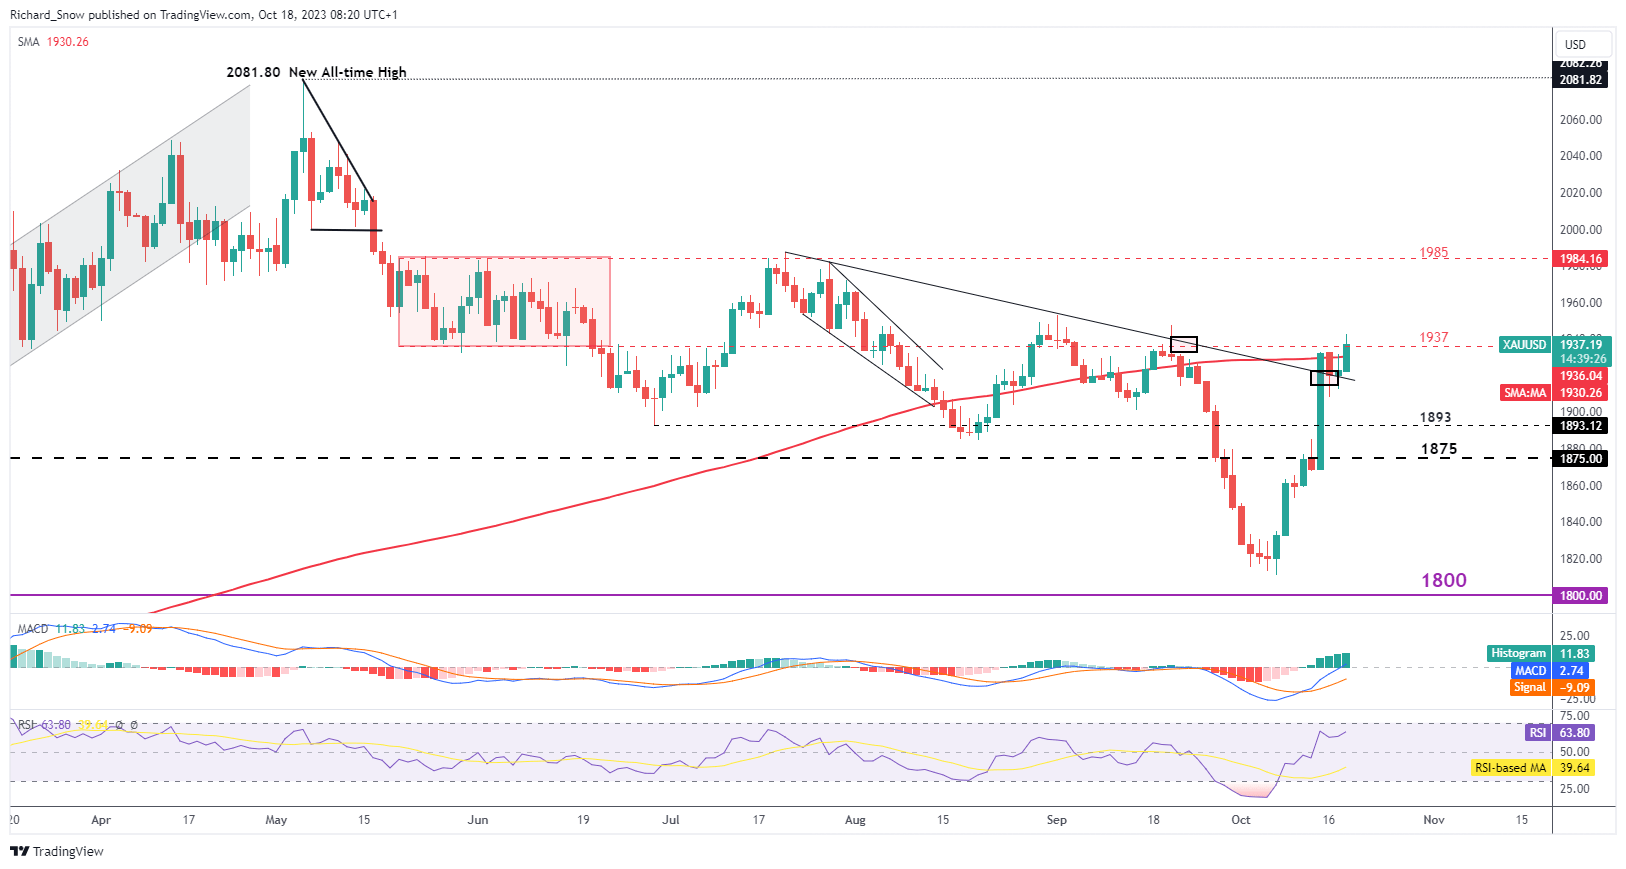
Source: TradingView, prepared by Richard Snow

Silver on the Rise but Gains May be Hard to Come by Ahead of Resistance
Silver, like gold, has also witnessed a concerted move to the upside. Looking at the weekly chart below, the metal has risen after rejecting a move lower at the 23.6% Fibonacci retracement of the 2021-2022 decline ($20.50). The metal now faces multiple upside challenges from the $23.20 level to the 200 DMA seen via the daily chart later in the article.
Silver (XAG/USD) Weekly Chart
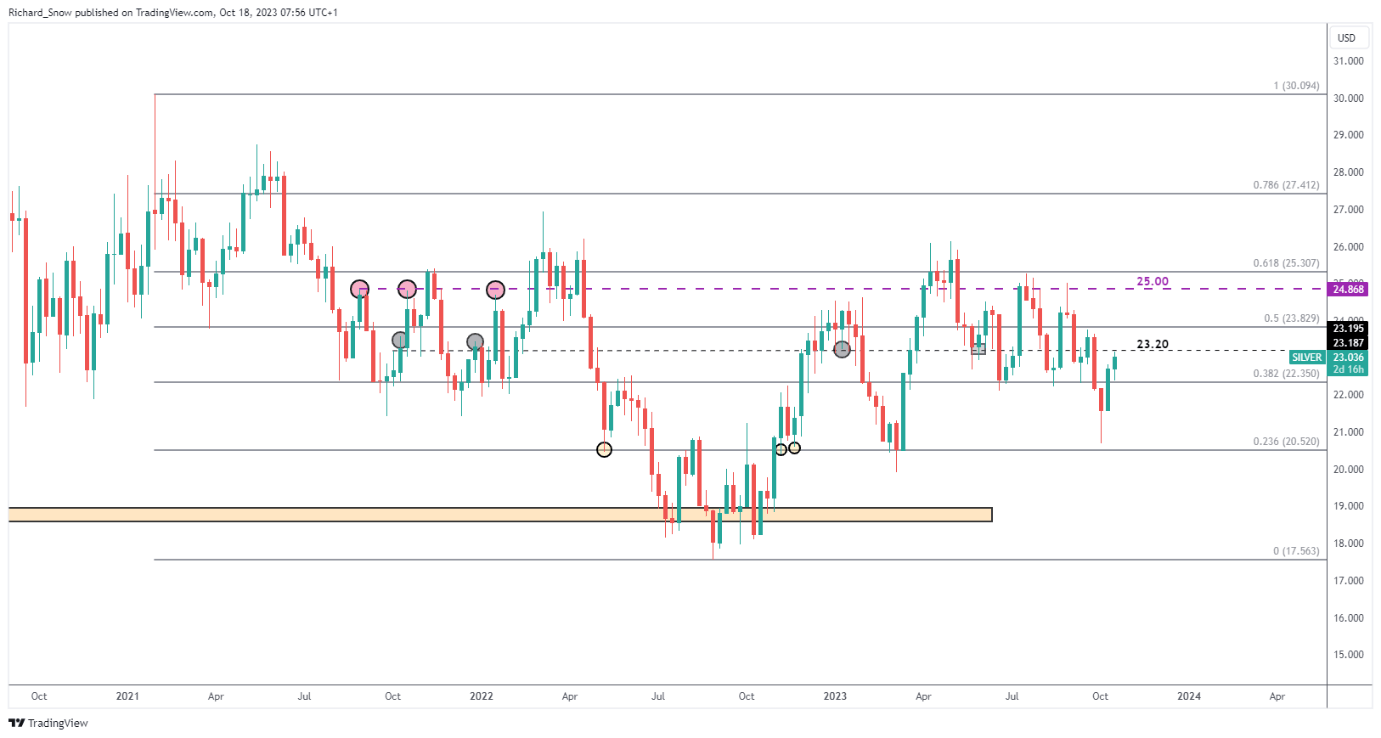
Source: TradingView, prepared by Richard Snow
The daily silver chart reveals the major test for a bullish continuation – the 200 DMA and $23.20. The simple moving average is widely followed by technical traders and tends to provide a pseudo support or resistance depending on where it is in relation to price action. In this case, it appears above price meaning it may complicate the ease at which prices rise from here. Further complicating matters for bulls is the $23.20 level.
Silver (XAG/USD) Daily Chart
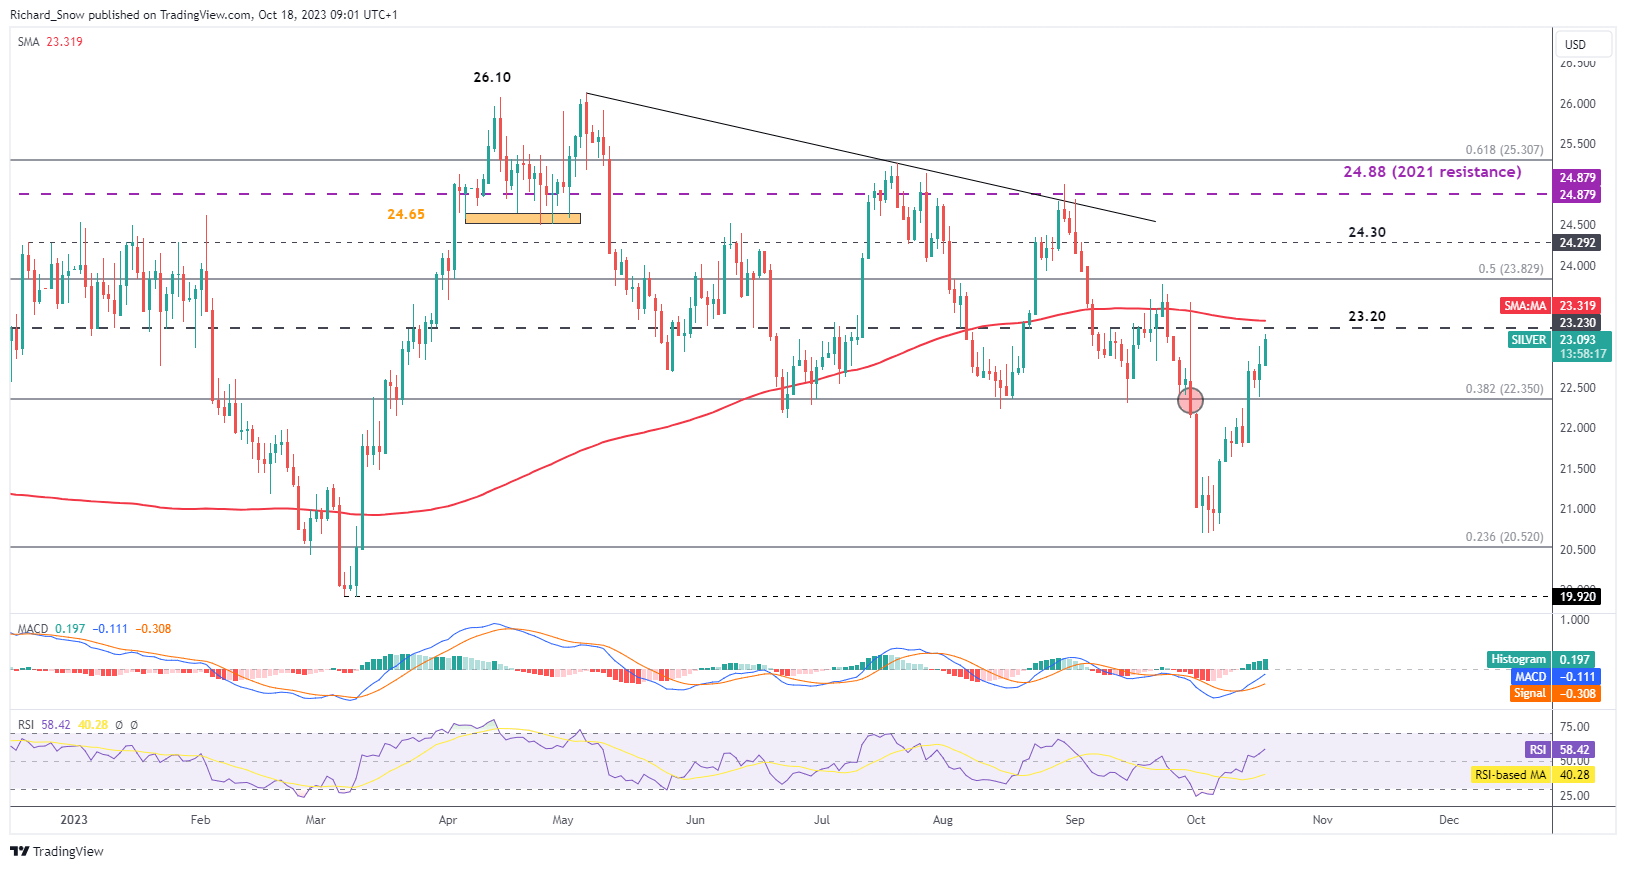
Source: TradingView, prepared by Richard Snow
--- Written by Richard Snow for DailyFX.com
Contact and follow Richard on Twitter: @RichardSnowFX


