


Gold Price (XAU/USD) Analysis, Price, and Chart
- Gold remains supported despite higher US Treasury yields.
- US inflation and the FOMC policy decision are next week’s main drivers.

For all market-moving data releases and events, see the DailyFX Economic Calendar
US Treasury yields maintain their gradual grind higher as the US government continues to sell vast quantities of government bonds across the curve. Sales announced yesterday include in excess of $200 billion of short-dated bills, $72 billion of notes, and $18 billion of re-opened 30-year bonds.
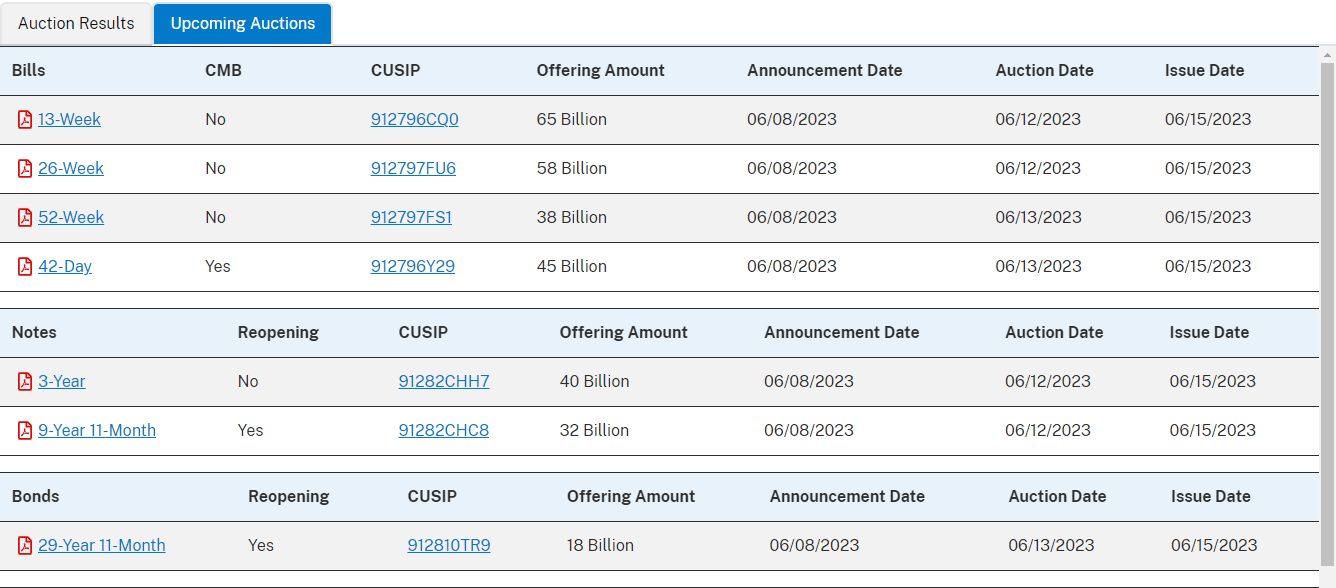
Data via Treasury Direct
The economic calendar is full of high-importance US data releases and events next week with Tuesday’s inflation report and Wednesday’s FOMC interest rate decision the two standouts. The post-FOMC decision press conference will need to be followed closely as well as the quarterly FOMC economic projections (dot plot). While the Fed is expected to leave rates unchanged, the press conference and projections will give the market a much clearer picture of the Fed’s current thinking.
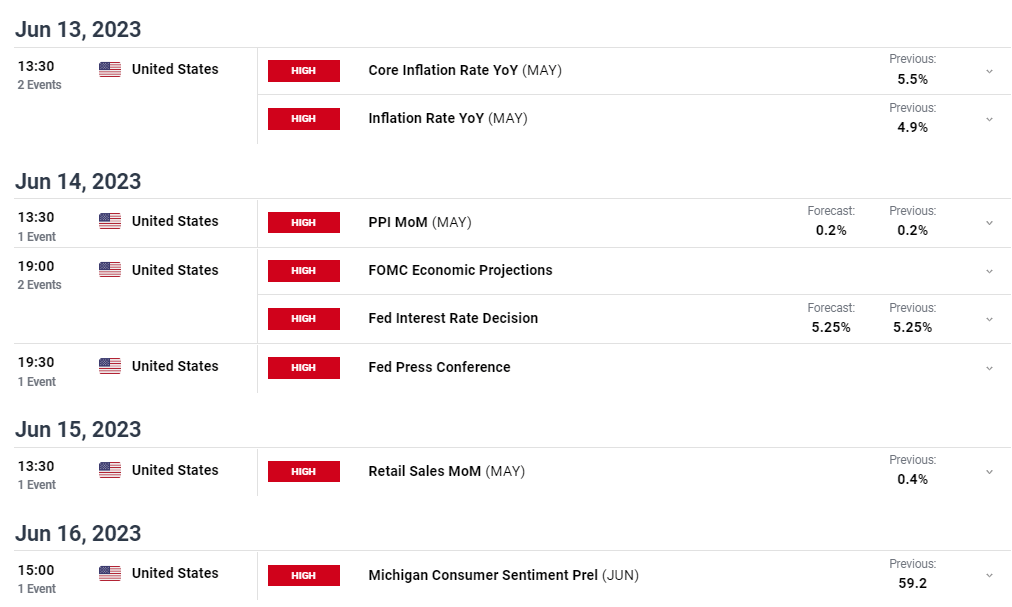
For all market-moving data releases and events, see the DailyFX Economic Calendar
The $1,932-$1,940/oz. zone is proving to be a strong level of short-term support for gold with the precious metal testing and failing to break through on a number of occasions over the last two weeks. Spot gold is also back above $1,960/oz, just, and is currently trying to break above the 20-day simple moving average, a short-dated indicator that has weighed on the precious metal for the last month. Next week’s calendar will define gold’s short-term future.
Gold Daily Price Chart – June 9, 2023
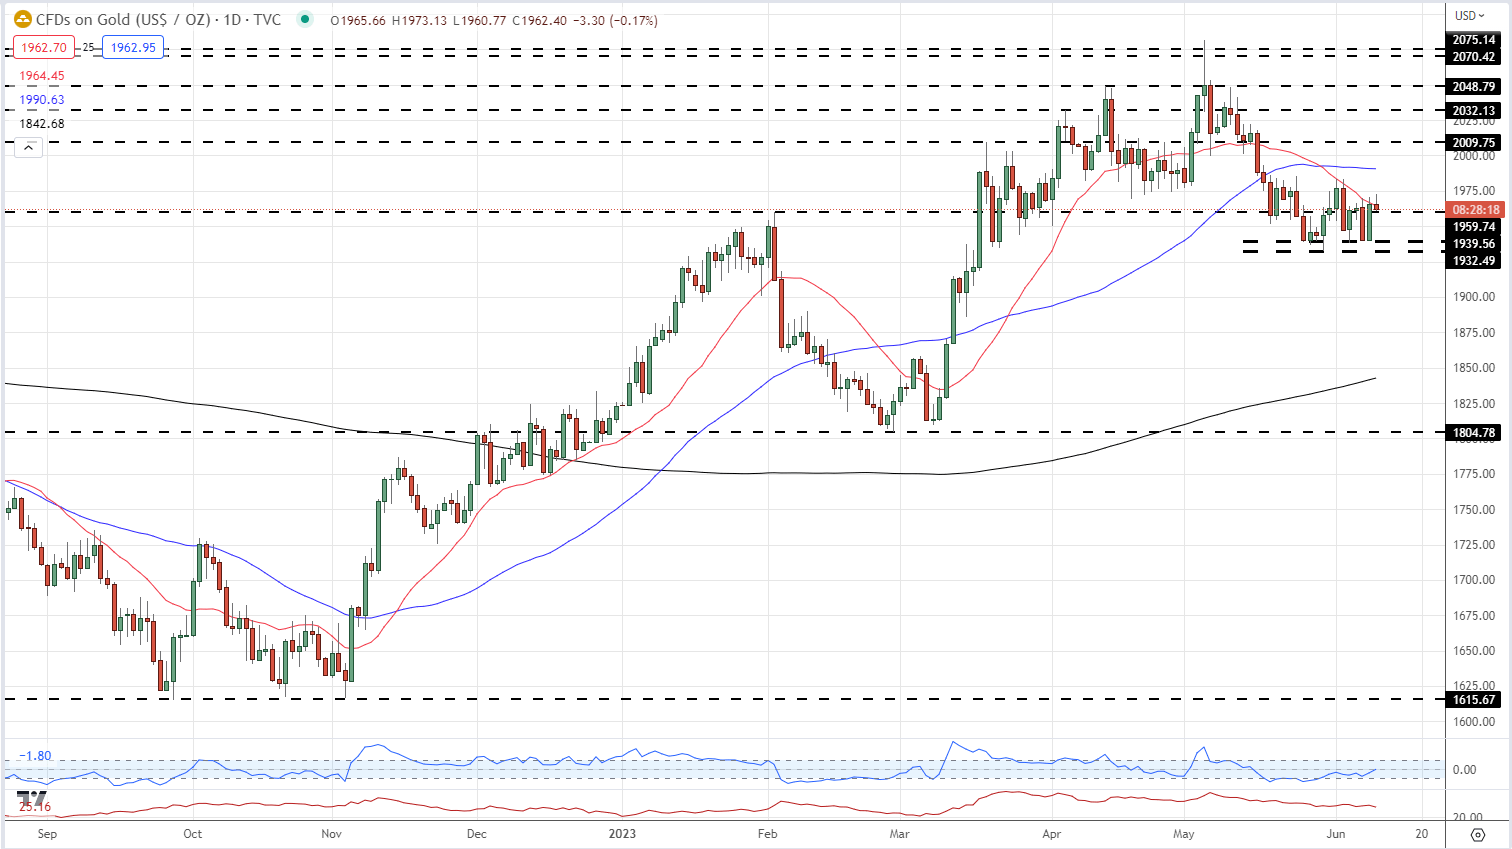
Chart via TradingView
| Change in | Longs | Shorts | OI |
| Daily | -4% | 3% | 0% |
| Weekly | -2% | 5% | 1% |
Retail Traders Boost Net-Short Positions
Retail trader data show 64.49% of traders are net-long with the ratio of traders long to short at 1.82 to 1.The number of traders net-long is 15.96% lower than yesterday and 0.28% higher than last week, while the number of traders net-short is 32.33% higher than yesterday and 0.76% lower than last week.
We typically take a contrarian view to crowd sentiment, and the fact traders are net-long suggests Gold prices may continue to fall. Positioning is less net-long than yesterday but more net-long from last week. The combination of current sentiment and recent changes gives us a further mixed Gold trading bias.
What is your view on Gold – bullish or bearish?? You can let us know via the form at the end of this piece or you can contact the author via Twitter @nickcawley1.


