Article written by IG Senior Market analyst Axel Rudolph
FTSE 100, DAX 40, S&P 500 Analysis and Charts
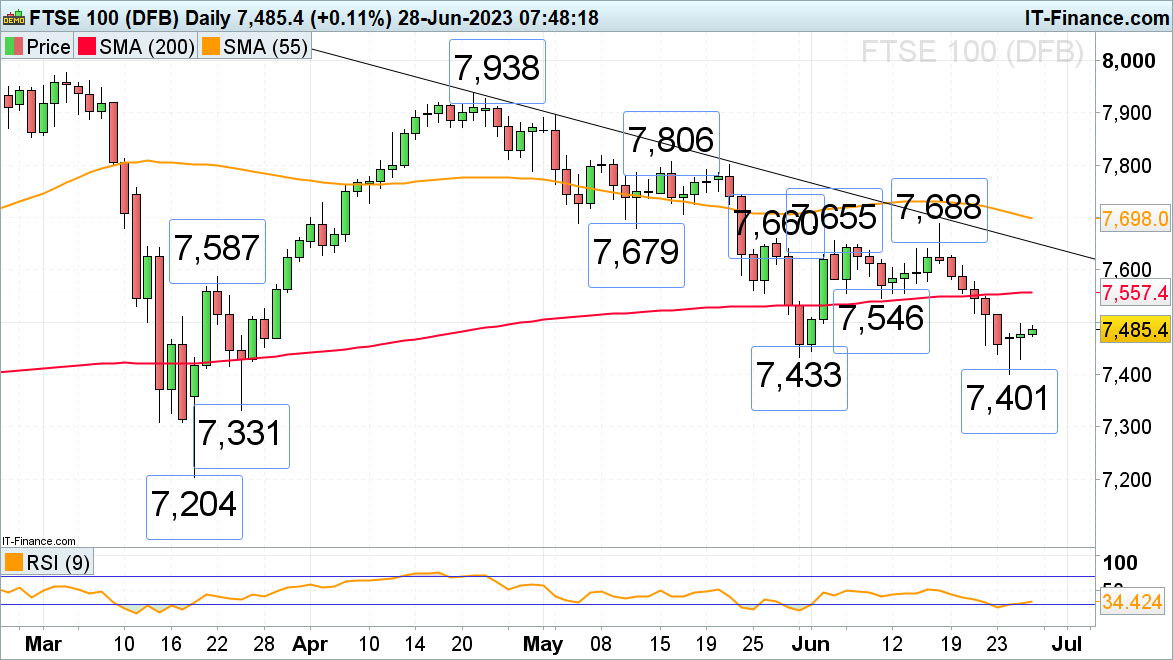
FTSE 100 stages a minor recovery
The FTSE 100 managed to find support and is now trading back above its 7,433 May low, helped by Wall Street which rose yesterday on better-than-expected US consumer sentiment, durable goods orders and new home sales. However, the bounce is lackluster with the UK blue chip index remaining technically under pressure while below the early June low at 7,546 and the 200-day simple moving average (SMA) at 7,557.
A drop through this week’s low at 7,401 on a daily chart closing basis would have further negative implications with the 24 March low at 7,331 and also the 7,204 March low being next in line.
FTSE 100 Daily Price Chart
Trade Smarter - Sign up for the DailyFX Newsletter
Receive timely and compelling market commentary from the DailyFX team
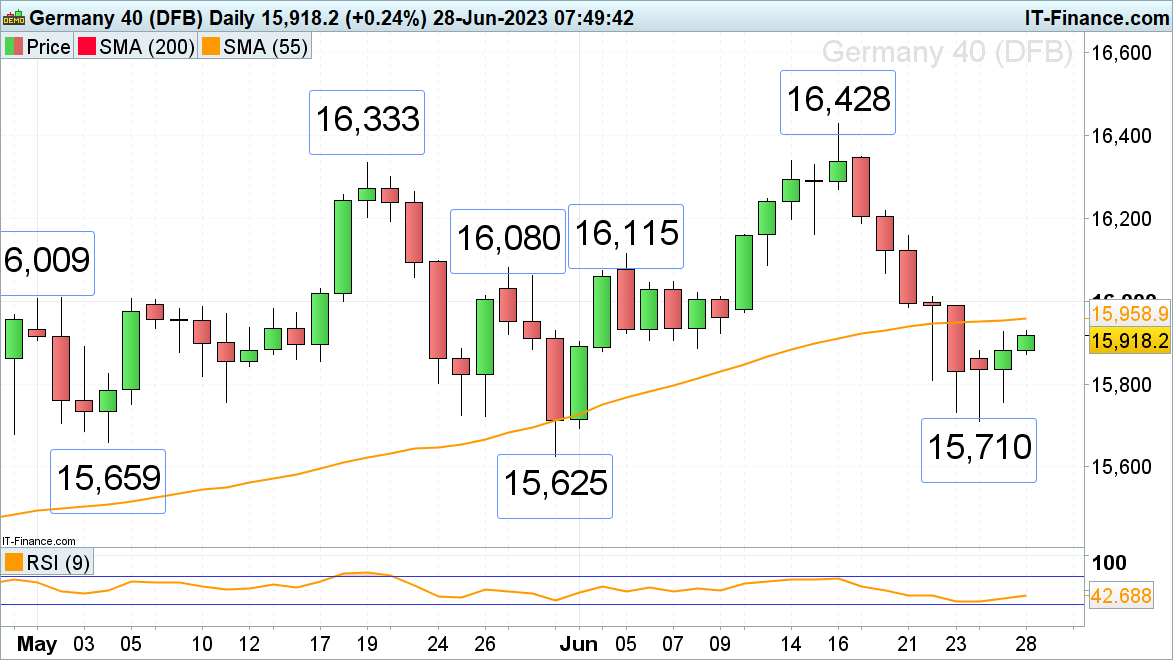
DAX 40 finds interim support
Following six consecutive days of losses the DAX 40 finally saw a positive close on Tuesday as solid US data pushed indices higher. The 55-day simple moving average (SMA) at 15,959 may well be revisited but may cap. Only a rise and daily chart close above Thursday’s 16,011 high would mean that the current bounce is gaining traction. While below this level, the odds of renewed downside being seen remain high.
A drop through last week's low at 15,710 would put key support between the May-to-June lows at 15,659 to 15,625 on the cards. If slid through, a significant medium-term top will have been formed.
DAX 40 Daily Price Chart

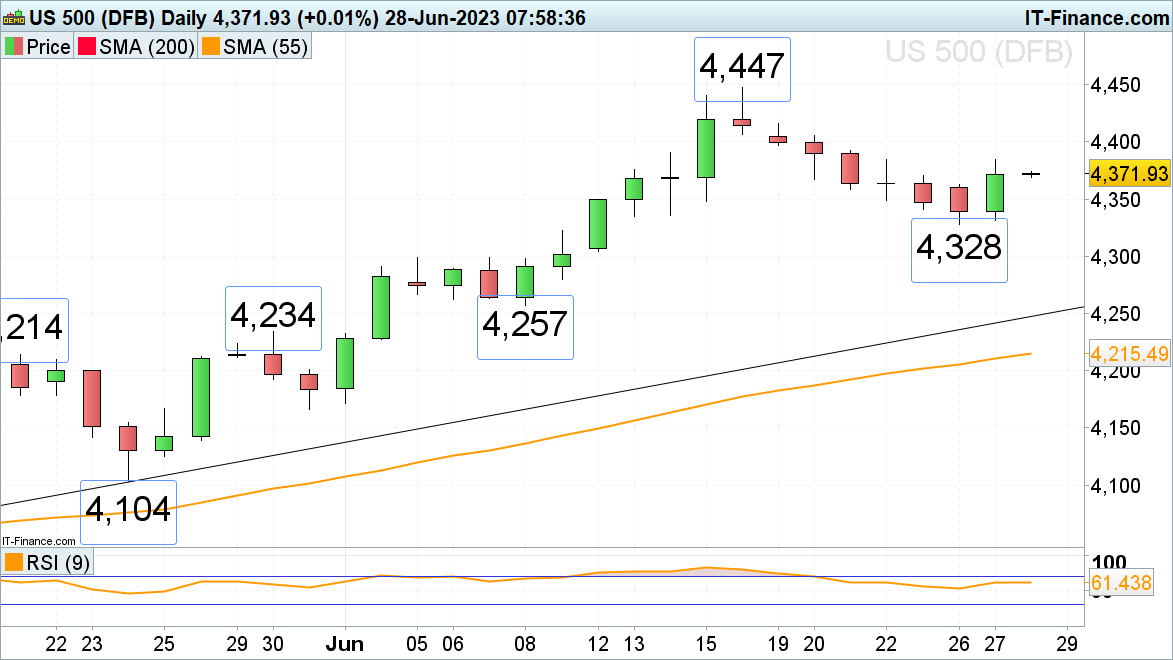
S&P 500 sees recovery
The S&P 500’s seven consecutive days of descent from its 14-month high at 4,447 halted at Monday’s 4,328 low as solid US data and improving sentiment provoked a rally to 4,384. For it to have legs, the minor psychological 4,400 mark and last Tuesday’s high at 4,405 would need to be exceeded. Only then would the 4,447 high be back in the frame.
Were the current advance to fizzle out and a slip through this week’s low at 4,328 to ensue, the 4,336 mid-June low would be targeted. Below which lies the early June high at 4,300.
S&P 500 Daily Price Chart