


Article by IG Senior Market Analyst Axel Rudolph
FTSE 100, DAX 40, Russell 2000 Analysis and Charts
FTSE 100 remains under pressure
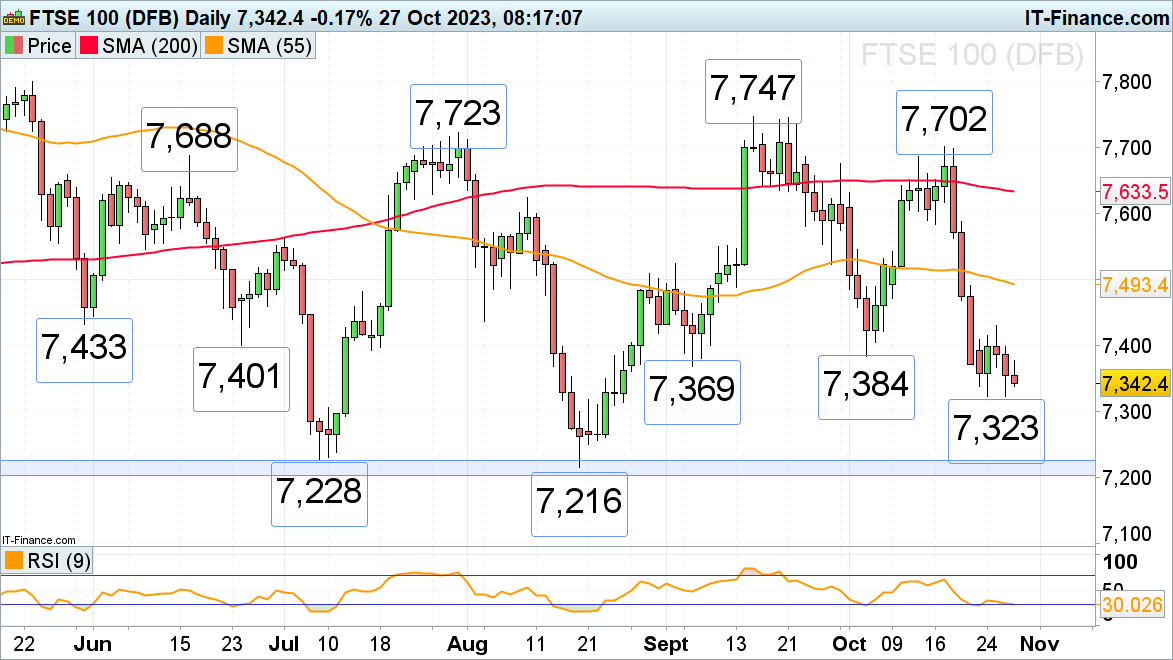
The FTSE 100 tries to remain above this week’s low at 7,323 but continues to be under immediate pressure whilst trading below Wednesday’s 7,430 high. Failure at 7,323 would put the 7,228 to 7,204 March-to-August lows back on the plate.
While 7,323 underpins, the early September and early October lows at 7,369 to 7,384 are to be revisited. A rise above the next higher 7,430 high could lead to the May and early August lows at 7,433 to 7,438 being back in sight. Further resistance can be seen along the 55-day simple moving average (SMA) at 7,493 and at the 7,524 early September high.
FTSE 100 Daily Chart
Download the Free FTSE 100 Sentiment Guide
| Change in | Longs | Shorts | OI |
| Daily | 13% | -7% | -4% |
| Weekly | -8% | 9% | 5% |
DAX 40 still trades in seven-month lows
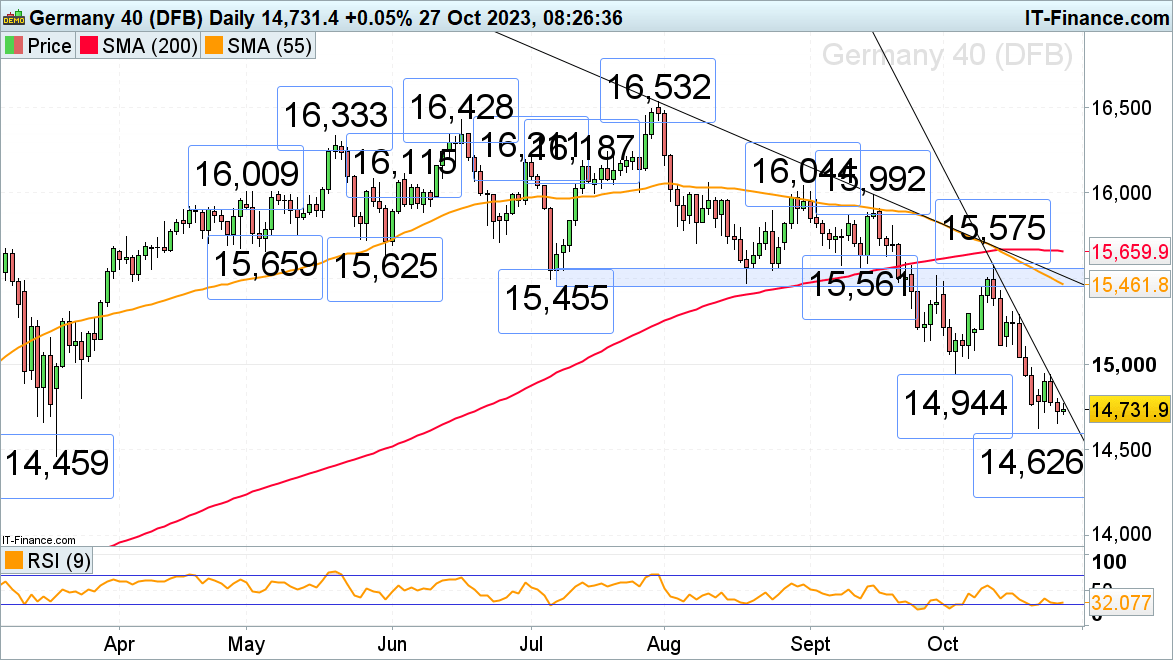
The DAX 40’s rejection by its early October 14,944 low, which acted as resistance on Tuesday, and the fact that the index remains below its accelerated downtrend line at 14,788, continues to put pressure on it with this week’s seven month low at 14,626 remaining within sight. If slipped through, the March trough at 14,459 would be back in focus.
Minor resistance above the accelerated downtrend line at 14,788 sits at Monday’s 14,853 high.
DAX 40 Daily Chart

Russell 2000 trades at a one-year low above key support
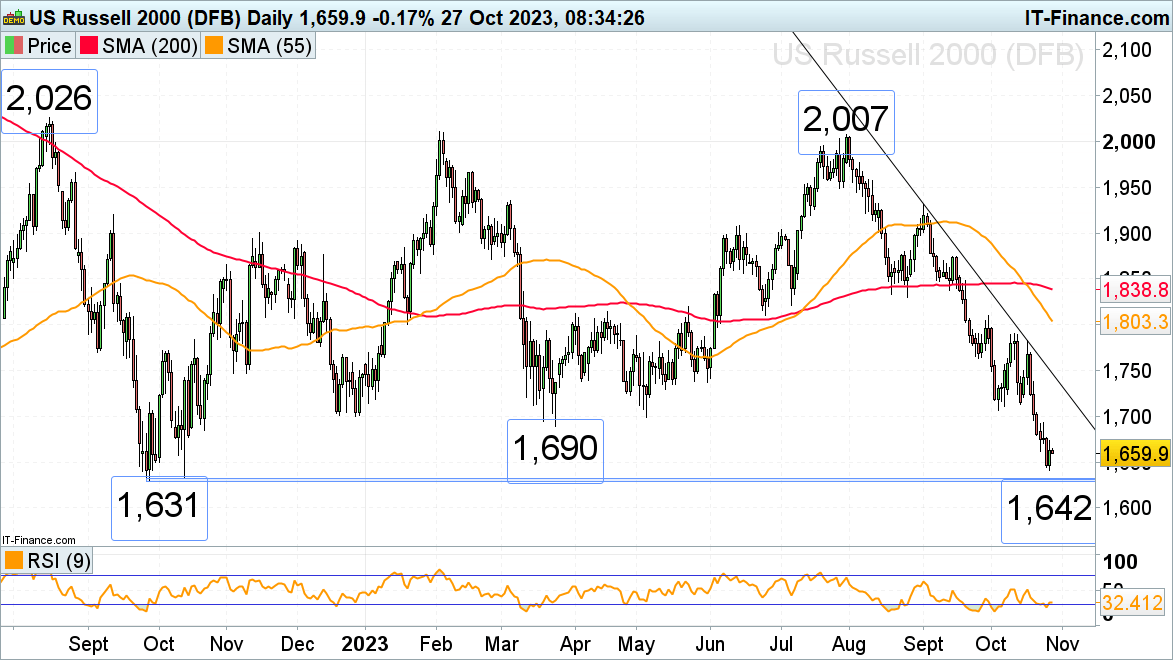
The Russell 2000, the great underperformer of US stock indices with a 5% negative performance year-to-date, is trading in one-year lows. The index has come close to its major 1,633 to 1,631 September and October 2022 lows as risk-off sentiment and worse-than-expected earnings drag the index lower.
While Thursday’s low at 1,642 holds, though, a minor bounce on short-covering trades into the weekend may ensue. The previous December 2022 to May major support zone at 1,690 to 1,700, now because of inverse polarity a resistance area, may be tested but is likely to cap. If not, minor resistance can be spotted at the 1,707 early October low and also at the 1,713 mid-October low.
Russell 2000 Daily Chart
Top Trading Opportunities for Q4


