


FTSE 100 and GBP/USD approaching important zones – another Dollar story?
- FTSE 100 approaching important key zones
- Potentially in for a rotation unless price breaks the key levels
- GBP/USD’s bulls may be running out of steam and could be in for another dollar story

The FTSE 100 has gained a solid 13% appreciation since the lows of October 13th 2022 at 6707 points per basis. It seems to be approaching an important key zone sitting between 7650 – 7700 points per basis. That may be a make it or break it situation for the UK’s stock market.
FTSE 100 – Daily Timeframe – December 5th 2022
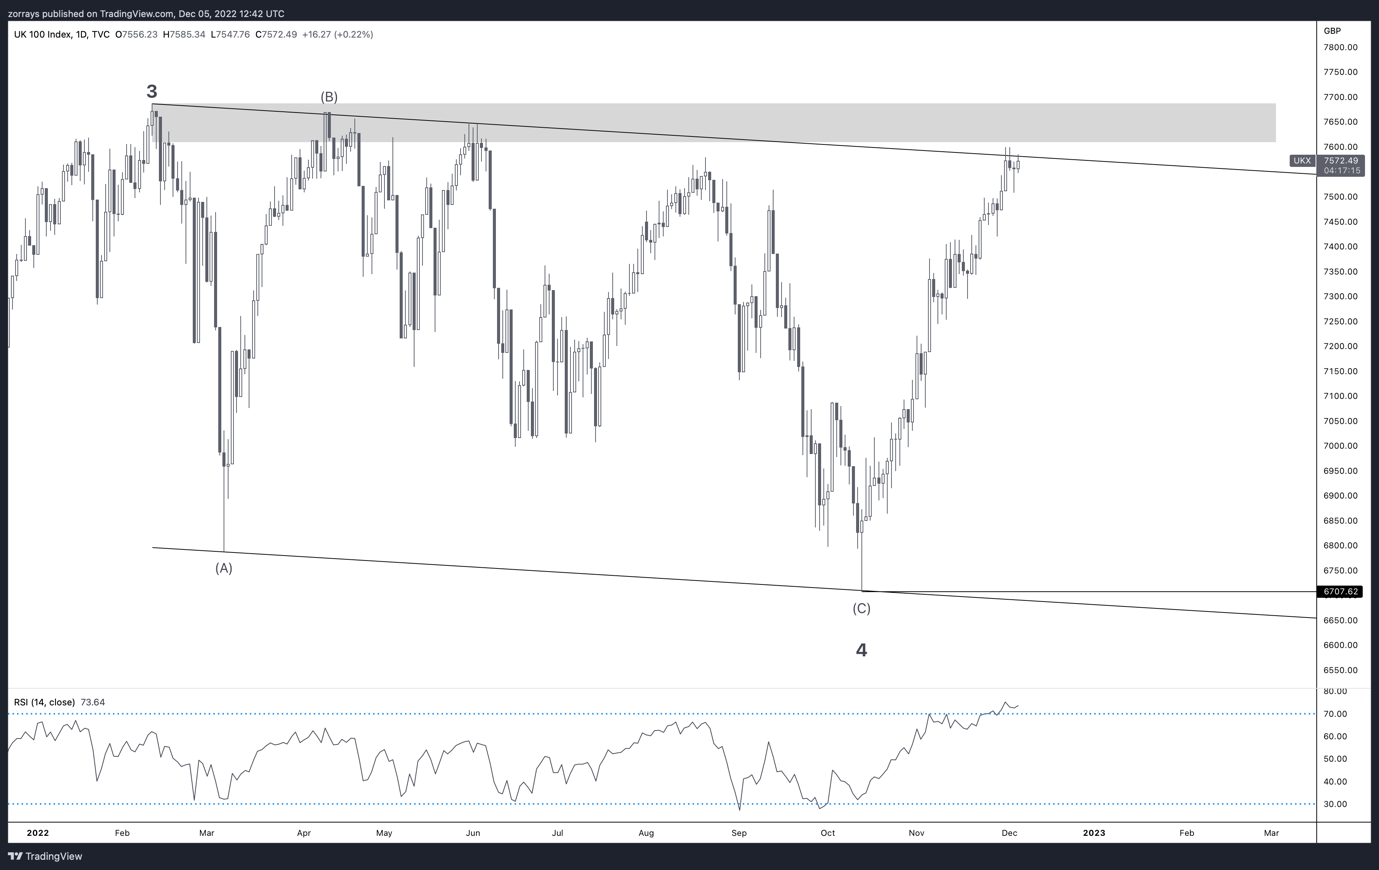
Chart prepared on TradingView by Zorrays Junaid
FTSE 100 – Weekly Timeframe – December 5th 2022
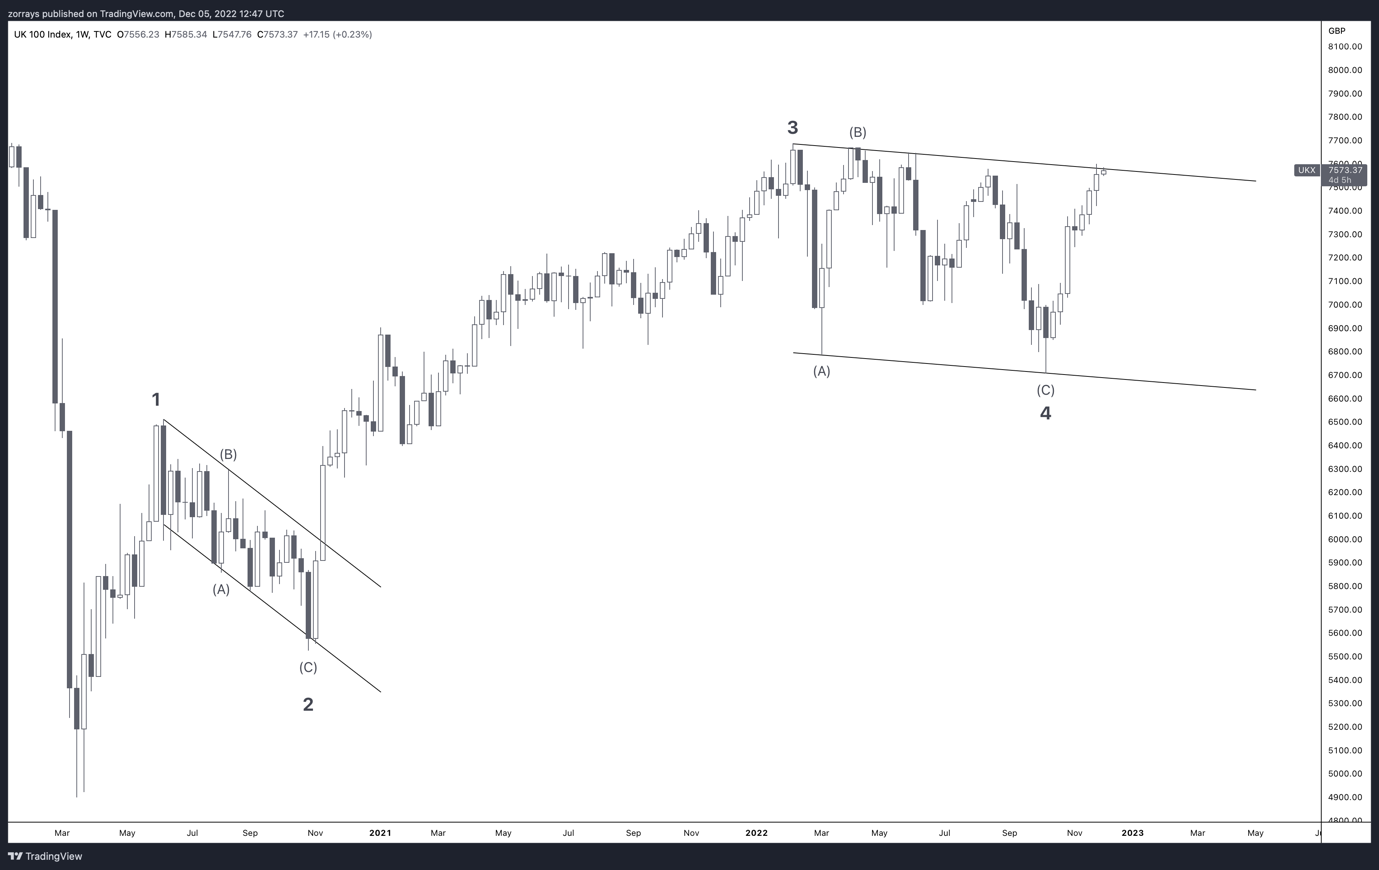
Chart prepared on TradingView by Zorrays Junaid
For the best part of the last 11 months, the FTSE 100 has been trading in a consolidating phase. We witnessed two fresh lows throughout the year. Therefore, considering how corrective the price action has been this year, a break of the shaded key zone as demonstrated on the daily timeframe would suggest that price is willing to continue its overall bullish cycle since 2020 as per shown on the weekly timeframe chart.
Now taking into consideration the UK’s economy’s current state is not the healthiest. The projected outlook of the economy does not look as bright too as the UK battle’s supply issues as well high interest rates to reduce the 11.1% inflation. It would take a lot of power to break the highs. Alternatively, instead of the breaking the highs we can potentially see the FTSE 100 stall and rotate to the downside and continue to correct.
Now lets take a look at it’s direct correlated FX instrument, GBP/USD.

GBPUSD – 4 Hour Timeframe – December 5th 2022
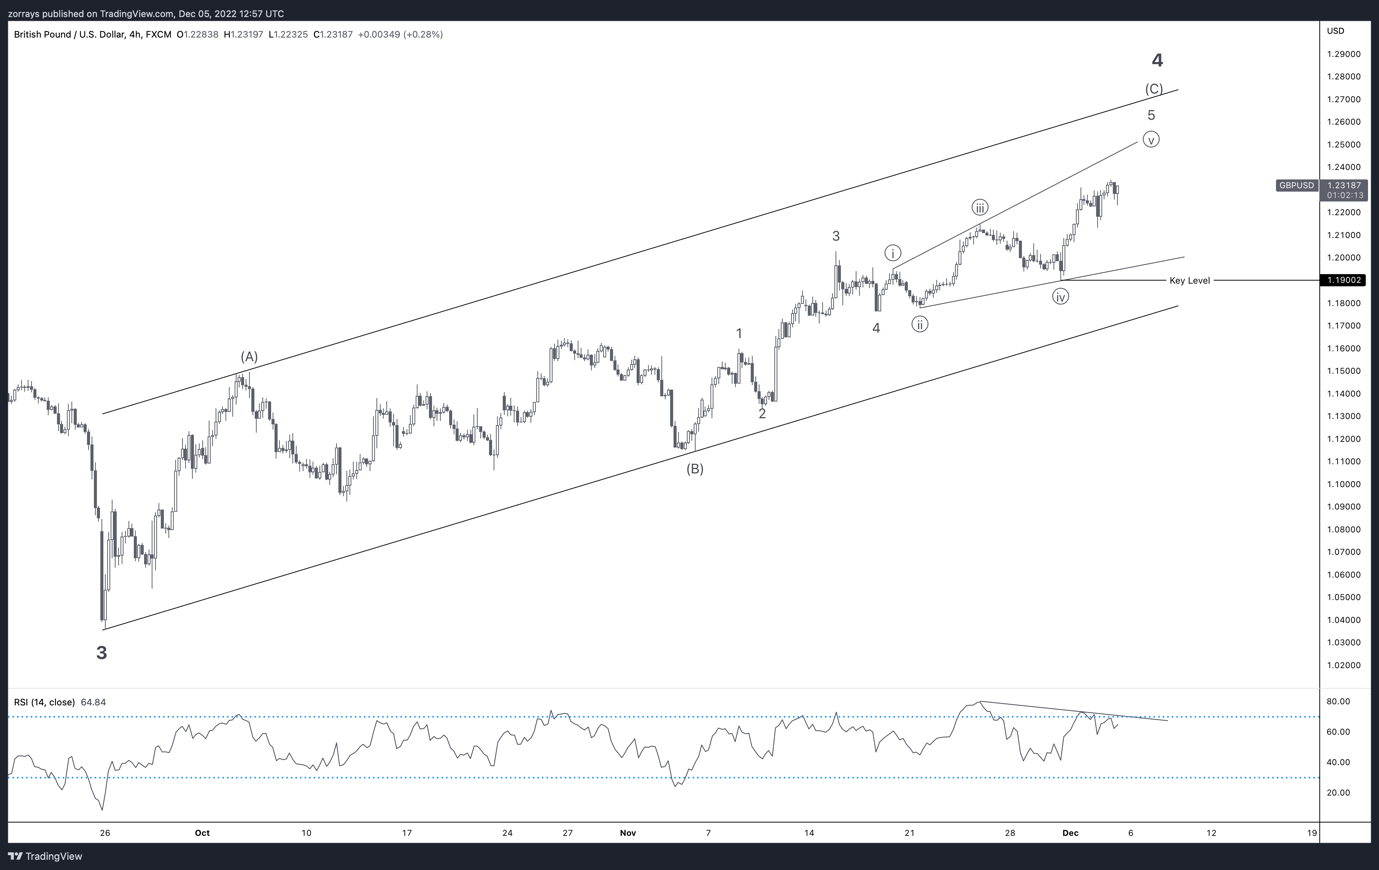
Chart prepared on TradingView by Zorrays Junaid
GBP/USD has been travelling within this ascending channel. Within this ascending channel indicates that price of GBP/USD in this bullish cycle is still corrective. Therefore, a good chance of another Dollar story meaning that we could see a new rally to the downside.
GBP/USD and the FTSE 100 positive correlates. When shares are sold within the FTSE 100, they are usually sold in dollars as opposed to pound sterling.
Supported by divergence on the RSI too. This means the bulls are running out of steam and could expect price to either stall or rotate to the downside. This does not mean that it will necessarily turnaround now, there is a good chance a bound of the upper bound of the ascending channel is on the cards.


