GOLD OUTLOOK & ANALYSIS
- Fading US economic data supportive of gold prices.
- US building permit data misses estimates.
- Gold looks towards $2000 resistance handle.

XAU/USD FUNDAMENTAL BACKDROP
Gold prices are relatively muted this Wednesday after yesterday’s rally as markets mull over weakening US economic data this week in the form of retail sales and building permits (see economic calendar below). Mortgage applications supplemented the current dovish slant with recent figures slipping further due to the Fed’s aggressive monetary policy.
GOLD ECONOMIC CALENDAR (GMT +02:00)
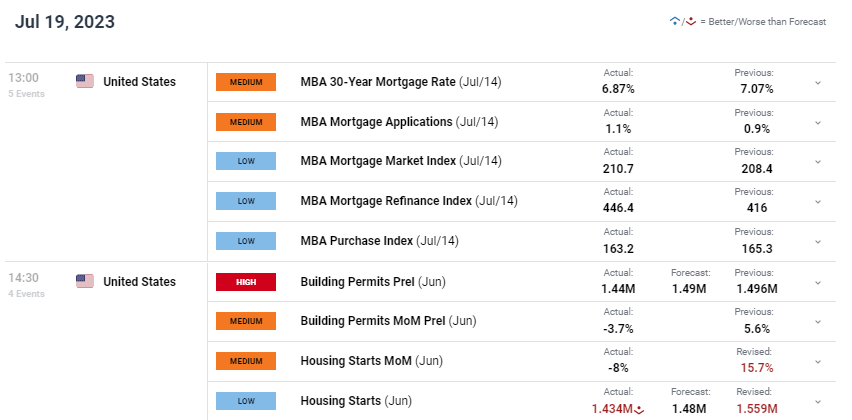
Source: DailyFX economic calendar
This brings into question the likelihood of another rate hike by the Federal Reserve next week. Currently, money market are favoring a 25bps hike with 96% probability (refer to table below) but may well move closer towards a 50/50 split considering recent data. With no additional economic data scheduled for today, there may be more rangebound moves evident.
FEDERAL RESERVE INTEREST RATE PROBABILITIES
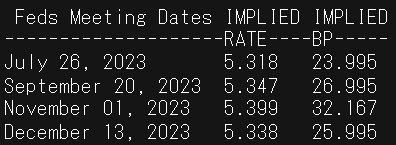
Source: Refinitiv
TECHNICAL ANALYSIS
GOLD PRICE DAILY CHART
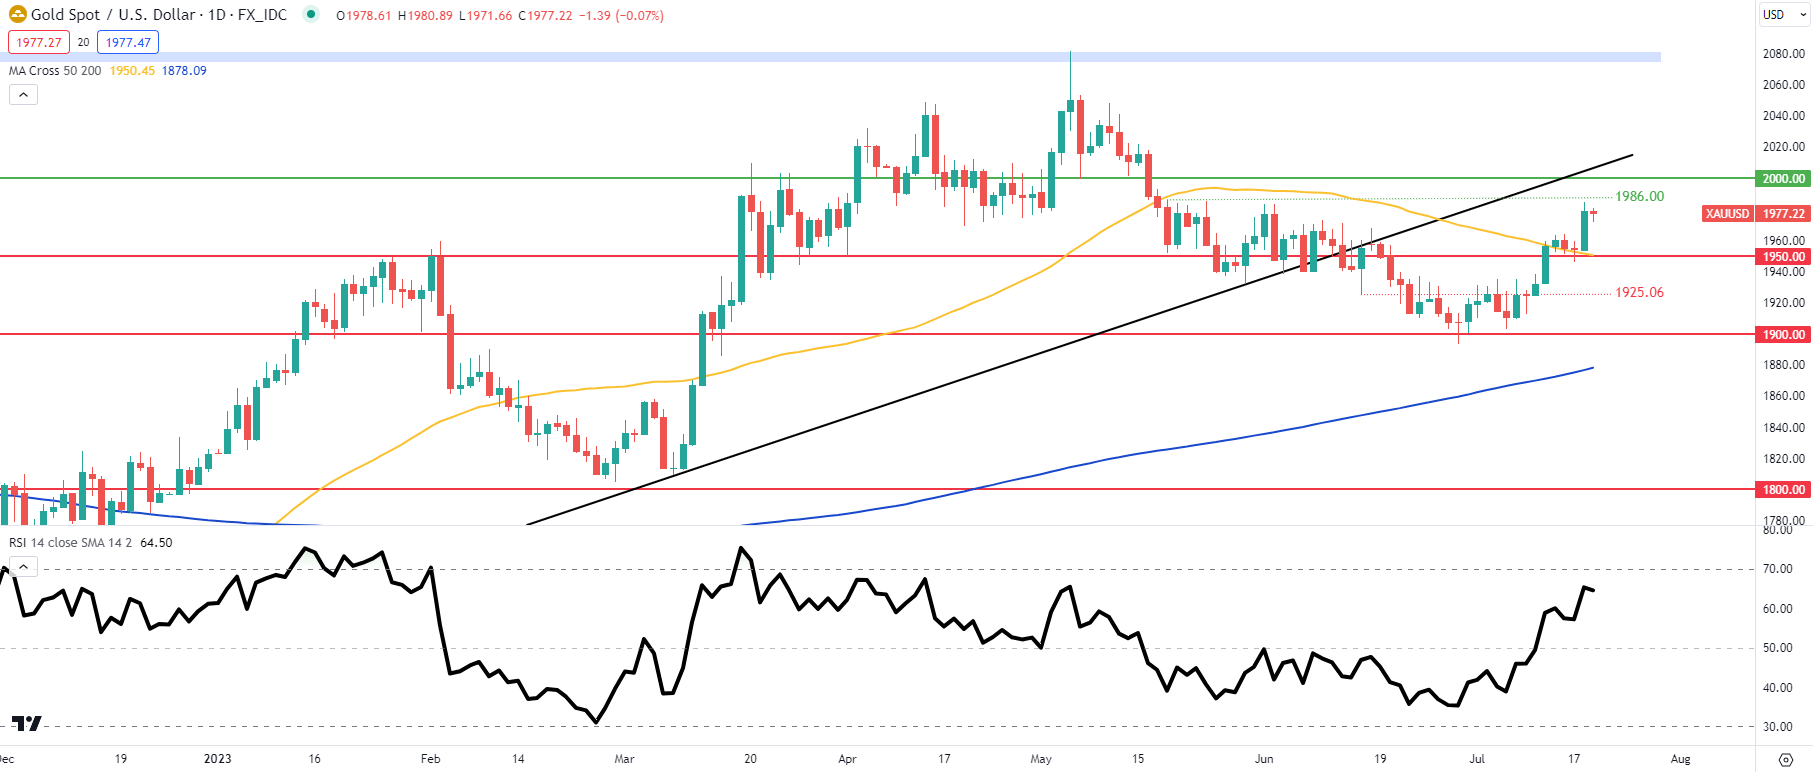
Chart prepared by Warren Venketas, IG
XAU/USD price action is looking to push up towards the 1986.00 swing high in mid-May. Prices are above the 50-day moving average (yellow), favoring short-term bullish momentum. The Relative Strength Index (RSI) is nearing overbought levels so there is still room for further upside to come but traders should be wary closer to the 2000.00 psychological mark.
Resistance levels:
- 2000.00
- 1986.00
Support levels:
- 1950.00/50-day moving average
IG CLIENT SENTIMENT: BULLISH
IGCS shows retail traders are currently distinctly LONG on gold, with 62% of traders currently holding long positions (as of this writing). At DailyFX we typically take a contrarian view to crowd sentiment but due to recent changes in long and short positioning, we arrive at a short-term upside disposition.
Contact and followWarrenon Twitter:@WVenketas