

U.S. DOLLAR ANALYSIS & TALKING POINTS
- US jobless claims fall eases as DXY finds some support.
- All eyes on next week’s US economic data.
- DXY looks to fundamentals for bull flag breakout.

USD FUNDAMENTAL BACKDROP
The Dollar Index (DXY) is marginally higher this Friday morning after yesterday’s slump following the US jobless claims report. With no economic data scheduled for today, focus shifts to next week’s plethora of high impact US releases (see economic calendar below). US CPI and the Federal Reserve’s interest rate decision will dominate. US CPI will be the primary factor for generating a short-term directional bias with recent data all culminating into a slowing US economy. Should inflation come in higher or elevated, this could unwind other data releases and heighten further monetary policy tightening forecasts from the Fed.
Trade Smarter - Sign up for the DailyFX Newsletter
Receive timely and compelling market commentary from the DailyFX team
US ECONOMIC CALENDAR (GMT +02:00)
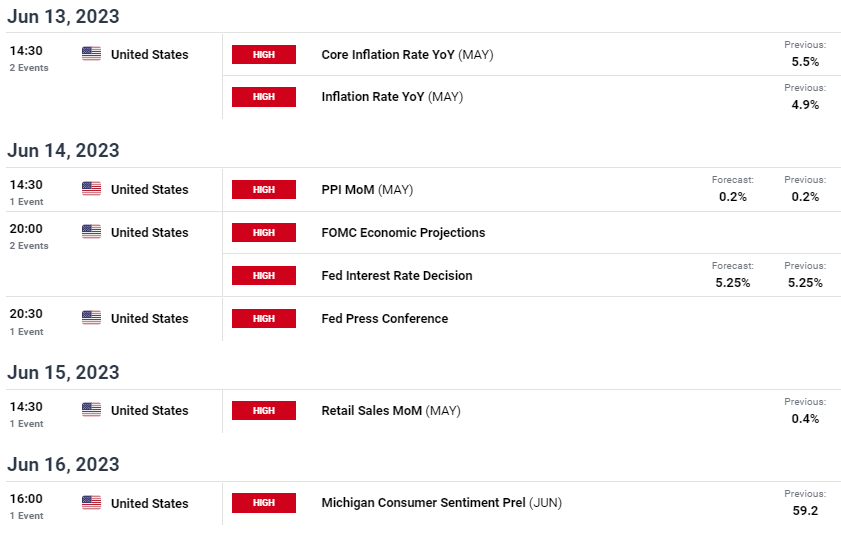
Source: Refinitiv
Money markets are currently pricing in a 75% probability of a rate pause for next week but may change in tandem with the US CPI print.
Foundational Trading Knowledge
Macro Fundamentals
Recommended by Warren Venketas
FEDERAL RESERVE INTEREST RATE PROBABILITIES
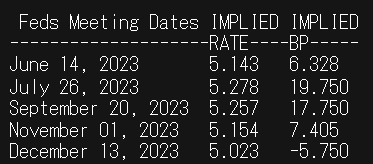
Source: Refinitiv
TECHNICAL ANALYSIS
Introduction to Technical Analysis
Candlestick Patterns
Recommended by Warren Venketas
U.S. DOLLAR INDEX DAILY CHART
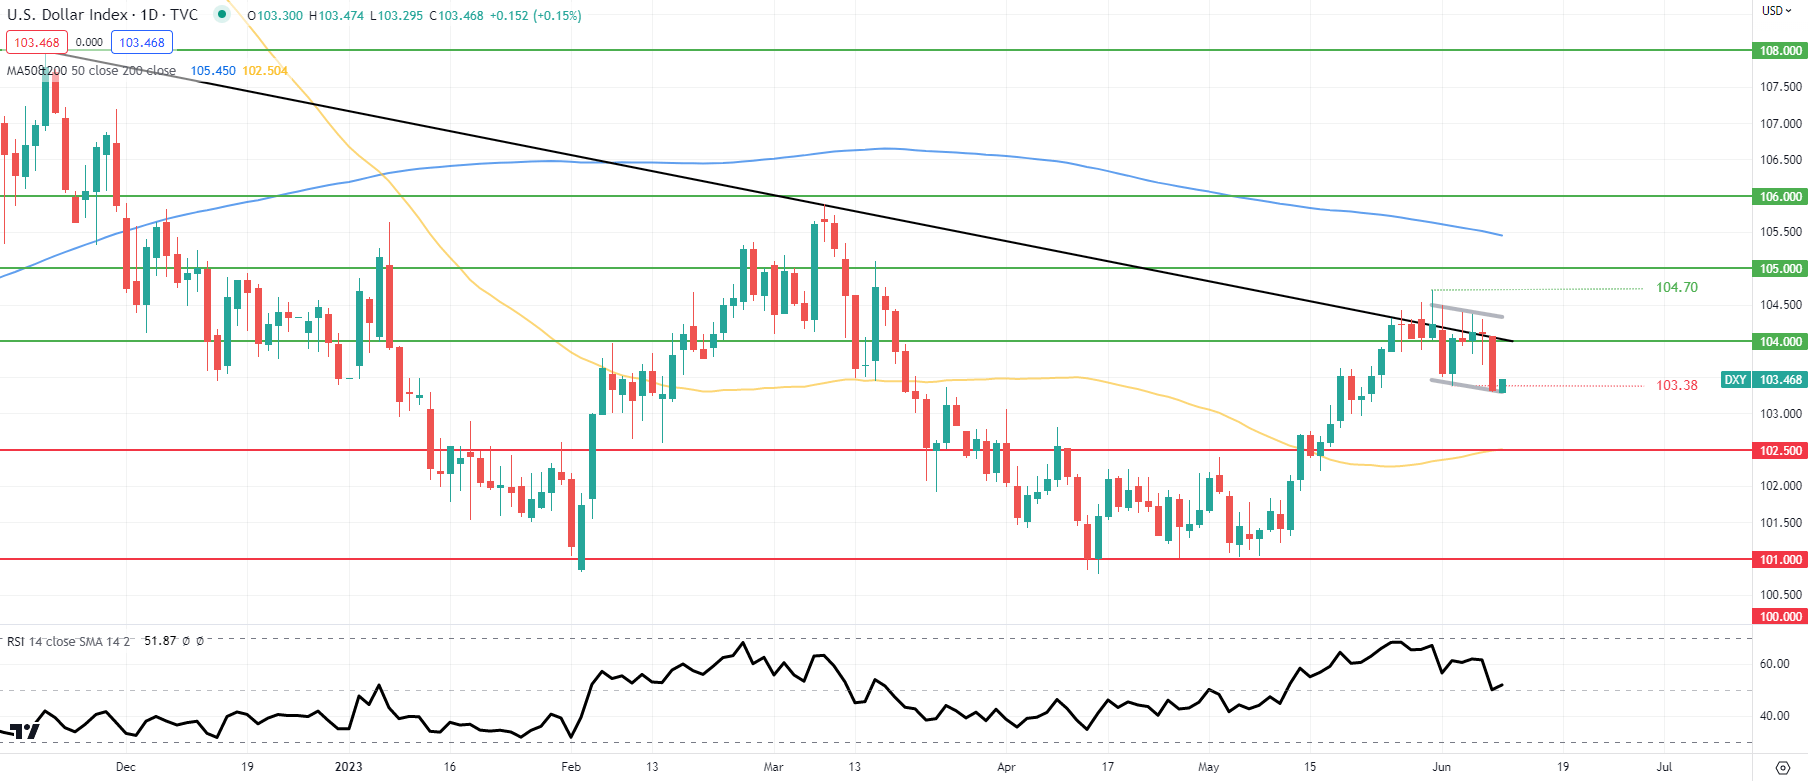
Chart prepared by Warren Venketas, IG
Daily DXY price action now resembles a bull flag type (grey) consolidation after failing to pierce the longer-term trendline resistance (black). This pattern may unfold with higher than expected US inflation next week but for today, a range bound move seems likely. The pattern may be invalidated should prices close below flag support, opening up the 50-day MA (yellow)/102.50 handle.
Uncertainty in the markets are emphasized by the Relative Strength Index (RSI) reading (+/-50), showing the reluctance amongst investors to fully back a Fed peak just yet.
Resistance levels:
- 105.00
- 104.70
- Flag resistance
- 104.00/Trendline resistance
Support levels:
- 103.38
- Flag support
- 102.50/50-day MA (yellow)
Contact and followWarrenon Twitter:@WVenketas