


U.S. DOLLAR ANALYSIS & TALKING POINTS
- Fed Chair Jerome Powell squashes prior dovish rhetoric.
- ECB in focus later today.
- Falling wedge remains in play on DXY daily chart.

USD FUNDAMENTAL BACKDROP
The Dollar Index (DXY) reacted favorably to the Federal Reserve’s interest rate decision yesterday. The 50bps rate hike increment was expected but the surprise came in the way of upward revisions to some key metrics including inflation and the Fed funds rate (terminal rate). The peak rate was pushed higher to 5.1% in 2023 from 4.6% which currently sits at 4.87% as shown in the table below. Core inflation followed a similar trajectory after being revised higher to 3.5% in 2023 from 3.1%. This reiterated the Fed’s fight against persistent inflationary pressures and further rate hikes. A surprise to many market participants after recent U.S. inflation data (PPI, CPI and core inflation) showed a consistent decline as well as contradicting Fed Chair Jerome Powell’s prior statement around moderating future rate hikes. Naturally, the U.S. dollar appreciated against most currency pairs and could continue to do so via the DXY depending on key economic data later today.
Trade Smarter - Sign up for the DailyFX Newsletter
Receive timely and compelling market commentary from the DailyFX team
FEDERAL RESERVE INTEREST RATE PROBABILITIES
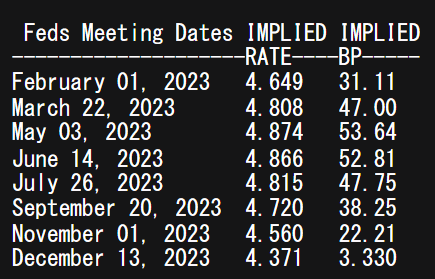
Source: Refinitiv
Looking at the economic calendar below, the ECB rate decision will be the primary focus for the DXY with the euro making up 57.6% of the index. A 50bps increment is projected with roughly 70% certainty at this point but there could be talk of Quantitative Tightening (QT) as well. Any dovish spin to the decision could support the USD. From a U.S. perspective, retail sales data for November is expected to come in lower than the prior month but a data beat could add to dollar upside.
ECONOMIC CALENDAR
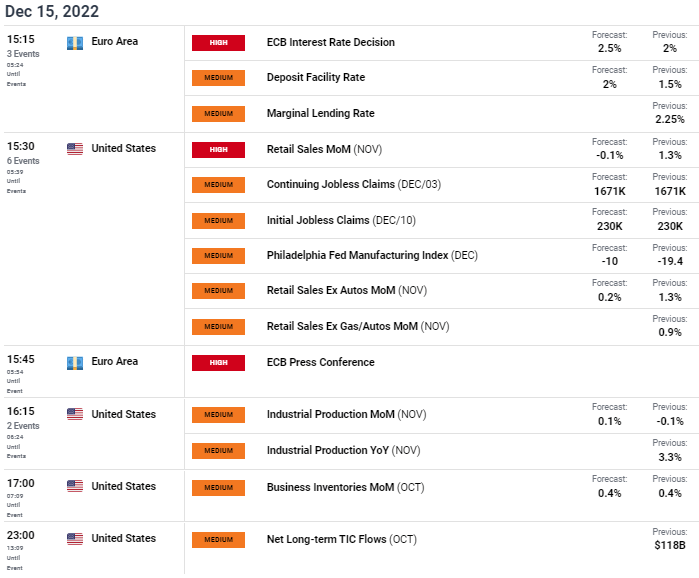
Source: DailyFX economic calendar
TECHNICAL ANALYSIS
Introduction to Technical Analysis
Candlestick Patterns
Recommended by Warren Venketas
U.S. DOLLAR INDEX DAILY CHART
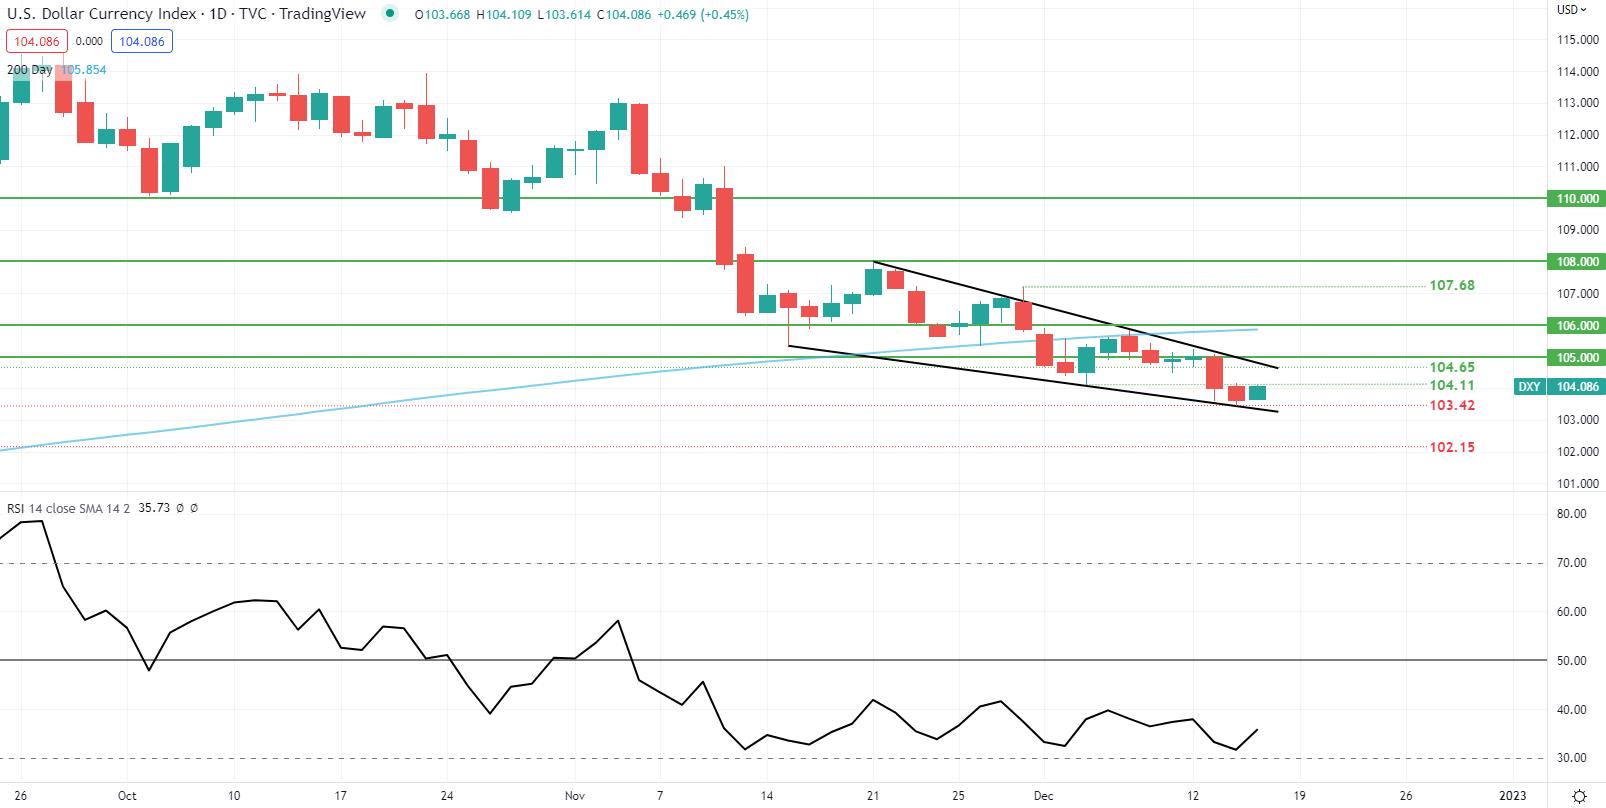
Chart prepared by Warren Venketas, IG
Daily DXY price action continues to trade within the recent and developing falling wedge chart pattern (black). Traditionally, this formation unfolds into subsequent upside following a confirmed breakout from wedge resistance. The Relative Strength Index (RSI) currently tests oversold levels with room for further downside before a turn higher.
Resistance levels:
- 105.00
- 104.65
- 104.11
Support levels:
- 103.42
- 102.15
Contact and followWarrenon Twitter:@WVenketas


