
US DOLLAR FORECAST:
- The U.S. dollar, as measured by the DXY index, slides on Monday, extending Friday’s losses following softer-than-expected U.S. employment data
- USD/JPY also deepens its pullback, steadily approaching Fibonacci support near 140.92
- All eyes will be on the U.S. inflation report this week

Most Read: EUR/USD Holds Post-Payroll Gains, Market Weighs Rate-Rise Chances
The U.S. dollar, as measured by the DXY index, fell slightly on Monday, extending last Friday's losses following softer-than-expected nonfarm payrolls figures. There were no major catalysts at the start of the new week, but traders were somewhat cautious ahead of Wednesday's key economic release: the latest U.S. consumer price index report.
July Headline CPI is projected to have risen 0.3% month-over-month, bringing the annual rate to 3.1% from 4.0% previously, a solid improvement in trend. The core gauge is also seen increasing 0.3% monthly, but the 12-month reading is forecast to remain somewhat sticky, easing only to 5.0% from 5.3% in May.
INCOMING US ECONOMIC DATA
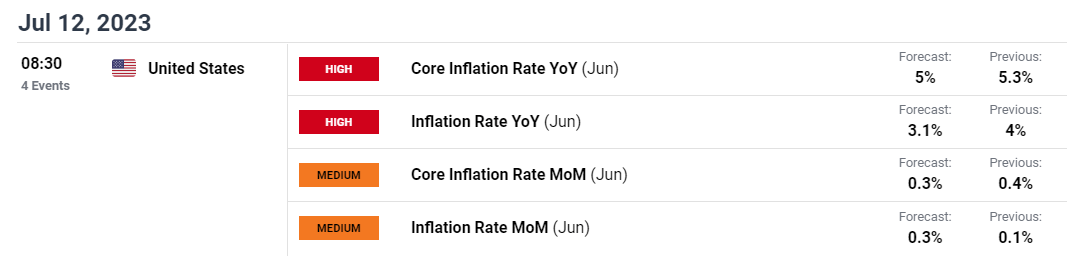
Source: DailyFX Economic Calendar
Traders should keep a close eye on the inflation numbers for insight into the Fed's monetary policy roadmap and the likely trajectory of the U.S. dollar.
An in-line report will be insufficient to discourage bets for another quarter-point hike at the July FOMC meeting, but it will be enough to prevent expectations to continue shifting in a more hawkish direction. In this context, the latter case could be somewhat bearish for the U.S. currency.
On the flip side, if data surprises to the upside by a wide margin, the interest rate outlook could become more aggressive, leading traders to price in further tightening beyond this month. This could potentially mean another 25 basis-points hike in September. Should this scenario play out, the U.S. dollar is likely to get bid up and rally against its top peers, especially against the low-yielders such as the Japanese yen.

US DOLLAR (DXY) TECHNICAL ANALYSIS
After Monday’s pullback, the DXY index is hovering above important support near the psychological 102.00 level. If bears manage to push prices below this floor, we should see a move toward the 2023 lows around 100.75. On further weakness, the focus shifts to 99.50.
On the flip side, if buyers regain control of the market and trigger a bullish turnaround, initial resistance appears at 103.25, a key technical barrier created by a medium-term descending trendline extended off the September 2022 highs. If this ceiling is taken out, the U.S. dollar may head toward its 200-day simple moving average.
US DOLLAR (DXY) TECHNICAL CHART
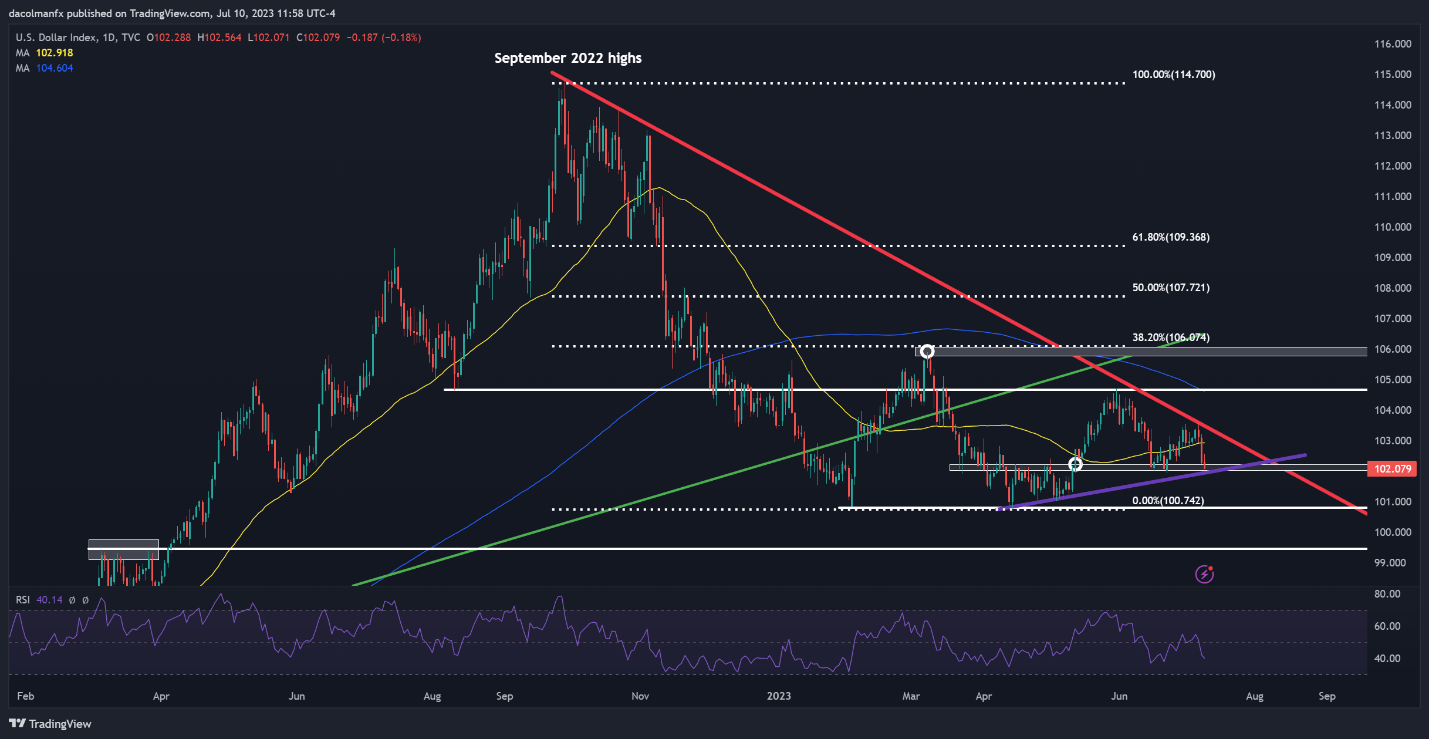
US Dollar (DXY) Chart Prepared Using TradingView

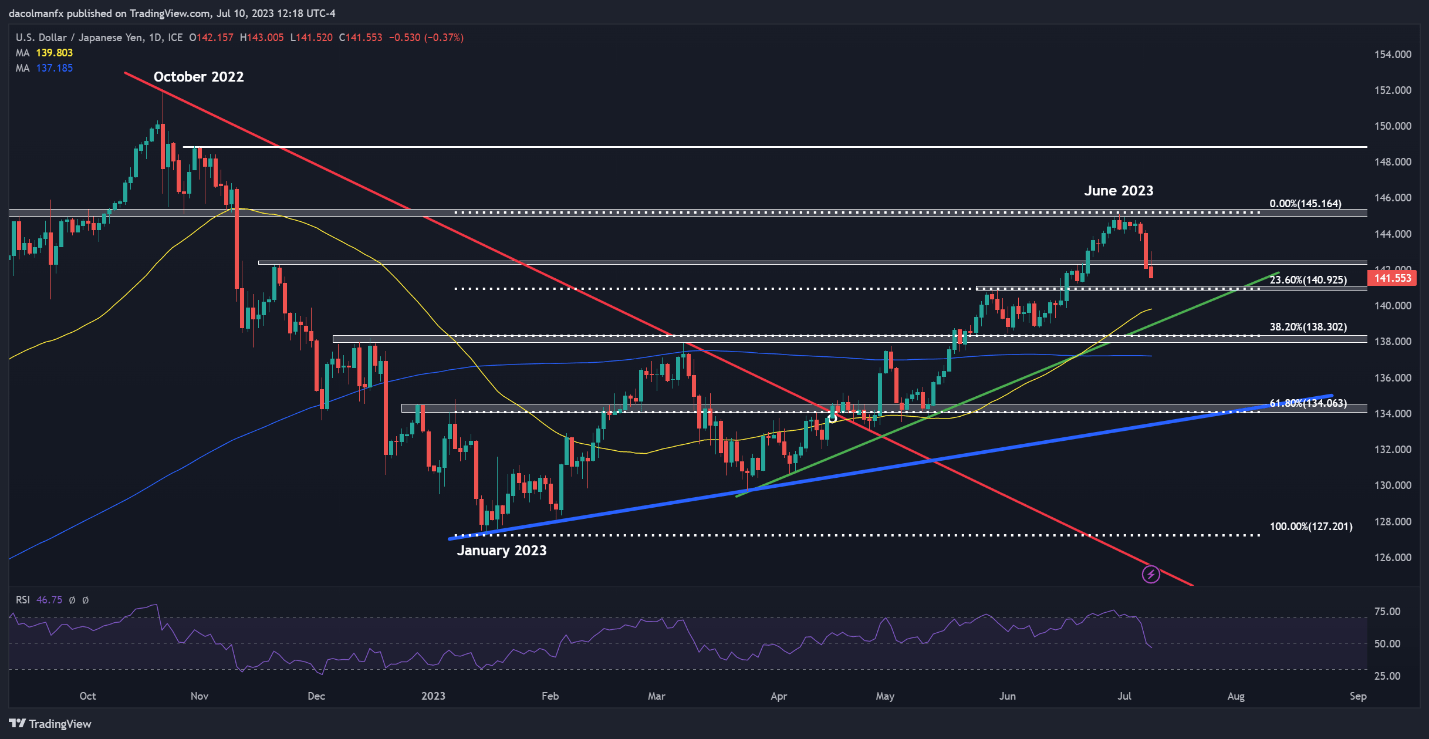
USD/JPY TECHNICAL ANALYSIS
The U.S. dollar has weakened sharply against the yen in recent days. This drop, however, may be part of a temporary correction rather than a trend reversal, as the greenback maintains a constructive outlook against its Japanese counterpart.
When an asset rises rapidly and becomes overbought, it is prone to healthy pullbacks as traders who have taken long positions begin to unwind them to take profits. This may be at play now, following the USD/JPY's ~3.5% rally in June.
With the pair still biased to the upside for now, weakness could fade soon. The daily chart shows that the latest slump, the exchange rate appears to be approaching an important support near 140.92, which corresponds to the 23.6% Fibonacci retracement of the Jan 2023/Jun 2023 advance.
USD/JPY is likely to establish a base around 140.02 before resuming its upward trajectory, with bulls likely first targeting 142.50, followed by the psychological 145.00 level. Conversely, if prices extend their decline and push below 140.92 decisively, selling pressure is likely to gather pace, setting the stage for a possible move toward 139.00.

USD/JPY TECHNICAL CHART