EUR/USD TECHNICAL ANALYSIS
EUR/USD blasted higher last week following weaker-than-expected U.S. economic data, taking out a clear barrier in 1.0670/1.0695 area. Bullish momentum, however, faded on Monday, with the pair stalling after failing to clear technical resistance at 1.0765, which corresponds to the 38.2% Fibonacci retracement of the July/October pullback.
For guidance on the near-term outlook, it is important to watch closely how prices behave around the 1.0765 mark. If the bulls manage to breach this ceiling, along with the 200-day simple moving average, we could see a move towards 1.0840. On further strength, the focus shifts to 1.0961, the 61.8% Fib retracement.
Conversely, if sellers stage a comeback and spark a bearish rejection from current levels, the first floor to monitor lies at 1.0695/1.0670. Below this threshold, market attention turns to trendline support at 1.0555. A violation of this technical zone could give the bears momentum to initiate a descent toward this year's lows around 1.0450.
Access a well-rounded view of the euro’s fundamental and technical outlook by downloading your complimentary copy of our Q4 trading forecast.

EUR/USD TECHNICAL CHART
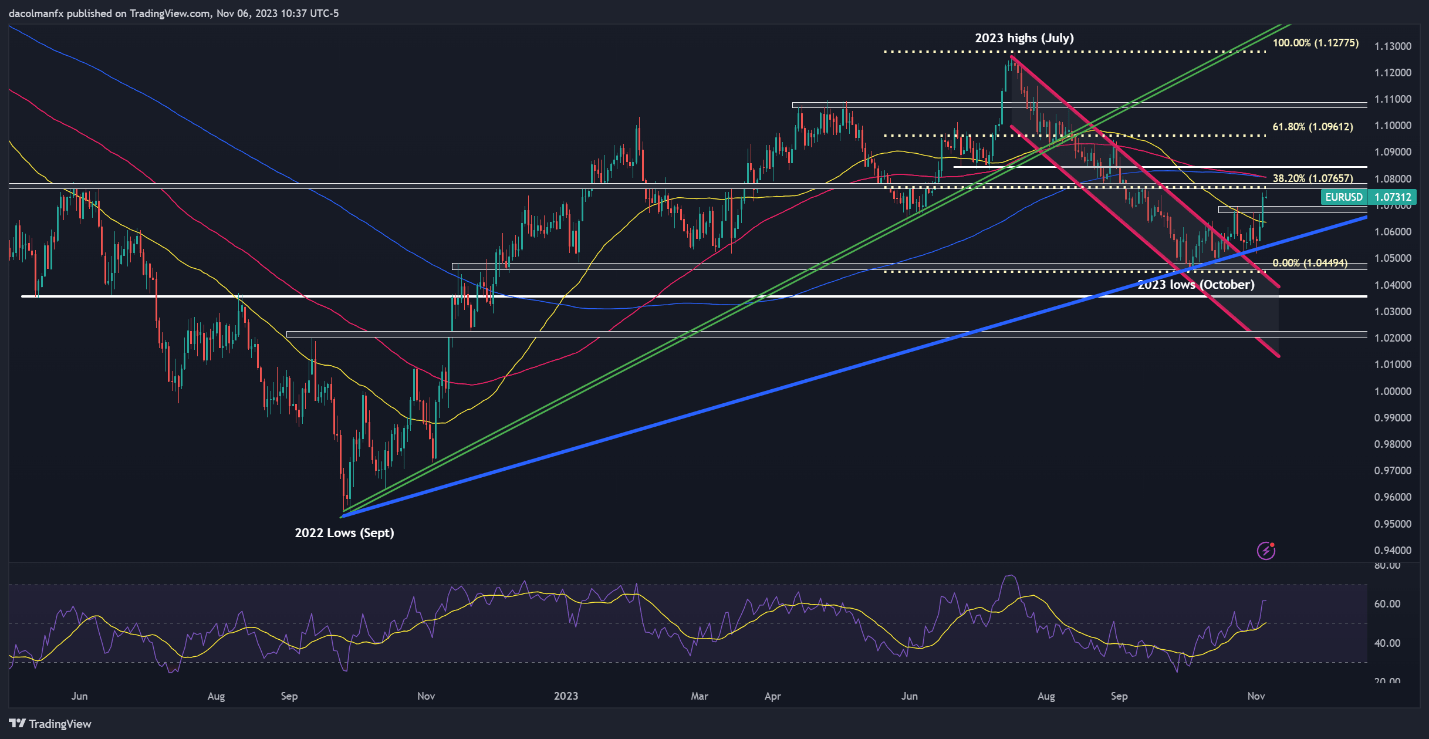
EUR/USD Chart Created Using TradingView
Looking to explore how retail positioning influences GBP/USD's price dynamics? Our sentiment guide offers invaluable insights. Secure your free copy now!
| Change in | Longs | Shorts | OI |
| Daily | 2% | -1% | 0% |
| Weekly | -10% | 9% | -1% |
GBP/USD TECHNICAL ANALYSIS
GBP/USD also lost upward momentum on Monday, unable to follow through to the upside after last week's bullish breakout. This may just be a temporary pause rather than a 180-degree turn, as the outlook for the U.S. dollar is starting to turn more negative on bets that the Fed is slowly abandoning its hawkish stance in light of economic developments in the U.S.
In terms of possible scenarios, if cable resumes its advance decisively and pierces overhead resistance stretching from 1.2450 to 1.2460, buying interest could accelerate, creating the right conditions for a rally towards 1.2591, a key ceiling forged by the 50% Fibonacci retracement of the July/October correction, as shown in the daily chart below.
On the flip side, if sellers mount a resurgence and recapture market control, initial support is positioned at 1.2320/1.2310. It is imperative for the bulls to staunchly defend this floor – any failure to do so may rekindle robust downside pressure, setting the stage for a pullback toward 1.2185. With ongoing weakness, a retest of October lows becomes a tangible possibility.
GBP/USD TECHNICAL CHART
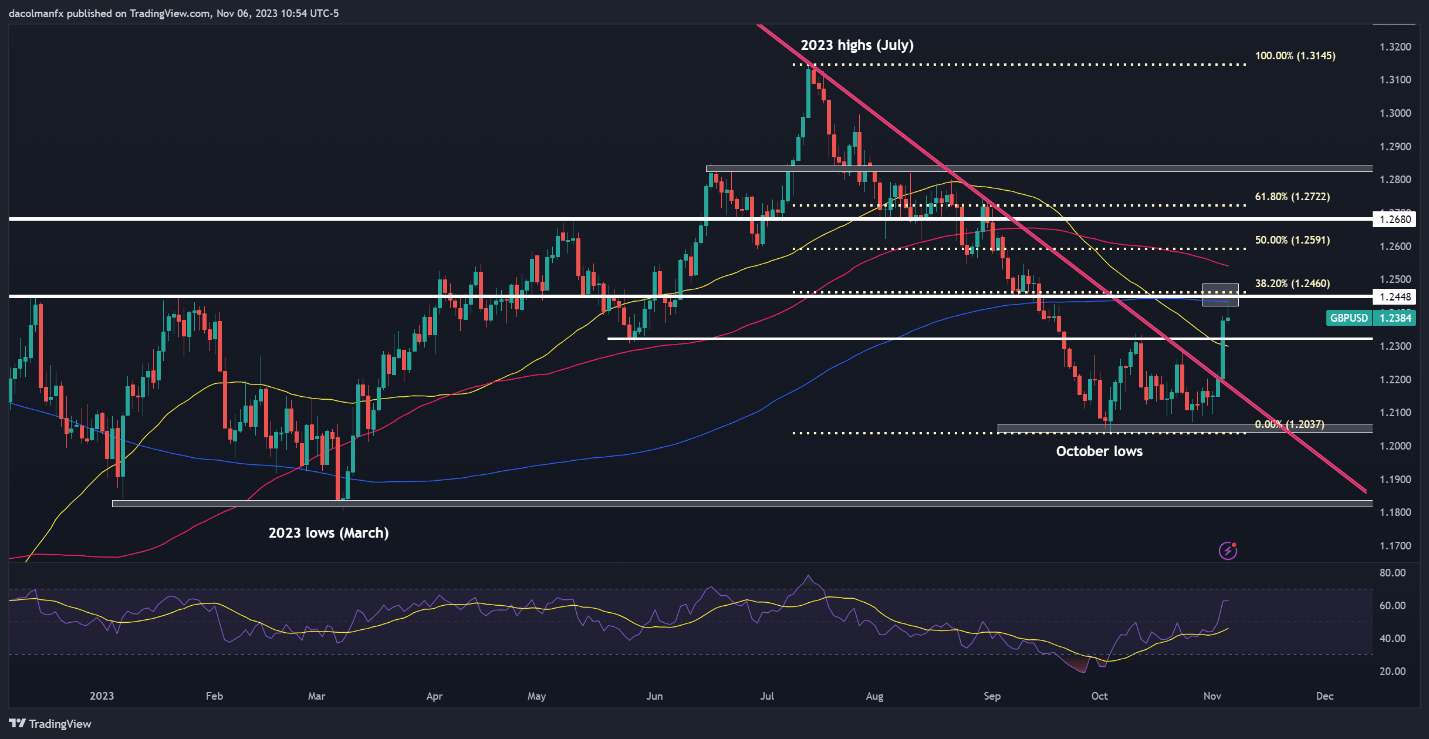
GBP/USD Chart Created Using TradingView
If you're wondering what’s in store for the Australian dollar in the coming months, grab a free copy of the Aussie’s fundamental and technical trading guide.

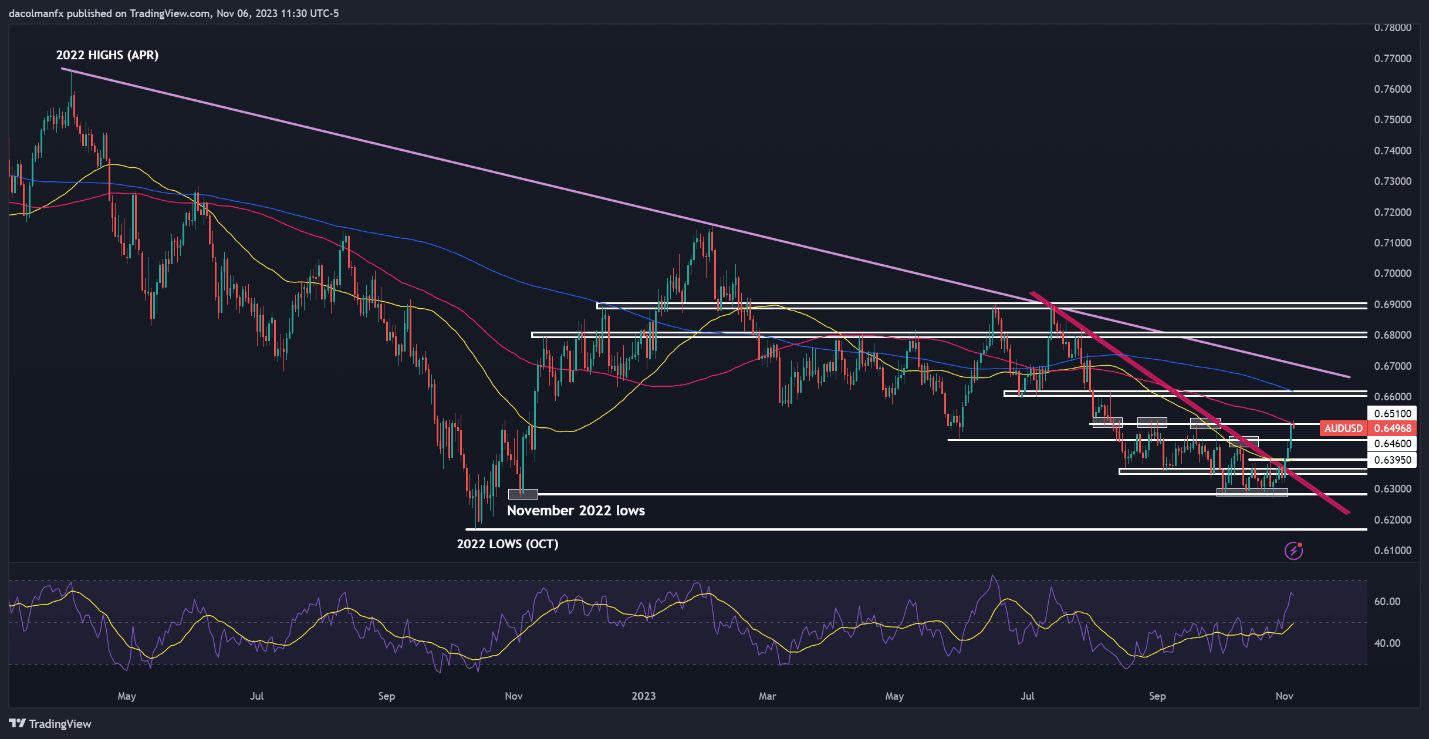
AUD/USD TECHNICAL ANALYSIS
AUD/USD has embarked on a bullish run since late October after bouncing from horizontal support in the 0.6300 area. The upward momentum has accelerated in recent days after the broader U.S. dollar began to correct lower following the November FOMC decision and softer-than-expected U.S. economic data. All this has created a more constructive backdrop for the Aussie.
After recent gains, the pair has successfully surmounted significant technical thresholds and made its way toward the 100-day simple moving average near 0.6510, which represents the next resistance in play. Price action on Monday suggests sellers may be attempting to regain control of the market in this region. If their efforts pay off, we could witness a retrenchment towards 0.6460, followed by 0.6395.
In contrast, if resistance around the 0.6500 handle is breached decisively on daily closing prices, the bears could capitulate and throw in the towel, paving the way for further market strength and a possible rally toward the 0.6600 region near the 200-day simple moving average. Above this ceiling, the focus transitions to long-term trendline resistance at 0.6700.
AUD/USD TECHNICAL CHART