EUR/USD, GBP/USD, AUD/USD & USD/JPY OUTLOOK
- EUR/USD breaks out to the upside, approaching a key Fibonacci level
- GBP/USD clears trendline resistance, reinforcing its recovery bias
- AUD/USD on the cusp of overtaking its 100-day simple moving average
Most Read: EUR/USD, Gold Forecast - Powell Fails to Steer Markets Towards Another Hike. What Now?
The broader U.S. dollar suffered heavy losses this past week after the Fed failed to guide investors toward pricing another interest rate hike for this cycle. Weaker-than-expected U.S. labor market and ISM services data reinforced the greenback’s retreat by driving Treasury yields in most maturities sharply lower. Against this backdrop, the euro, the British pound, and the Aussie staged a solid rally against their American counterpart. The Japanese yen, meanwhile, ended the week virtually flat, with the USD/JPY settling around the 149.50 mark.
This article focuses on EUR/USD, GBP/USD, AUD/USD, and USD/JPY from a technical perspective, examining critical price levels for the upcoming trading week.
Curious about the expected path for EUR/USD and the market catalysts that could spark volatility? Explore all the details in our Q4 euro trading forecast. Get your free copy now!

EUR/USD TECHNICAL ANALYSIS
EUR/USD exploded to the upside heading into the weekend following disappointing U.S. economic reports, clearing former resistance in the 1.0670/1.0695 range. If this bullish breakout is sustained in the coming trading sessions, buyers could become emboldened to challenge Fibonacci resistance and the 200-day simple moving average near 1.0765 level. On further strength, the focus shifts to 1.0840.
On the other hand, if sellers return and regain command of the market, initial technical support is positioned at 1.0695/1.0670, but further losses may be in stored on move beneath this threshold, with the next bearish target at 1.0550. If dynamic trendline support at 1.0550 is violated, we could see a push toward this year’s lows around 1.0450.
EUR/USD TECHNICAL CHART
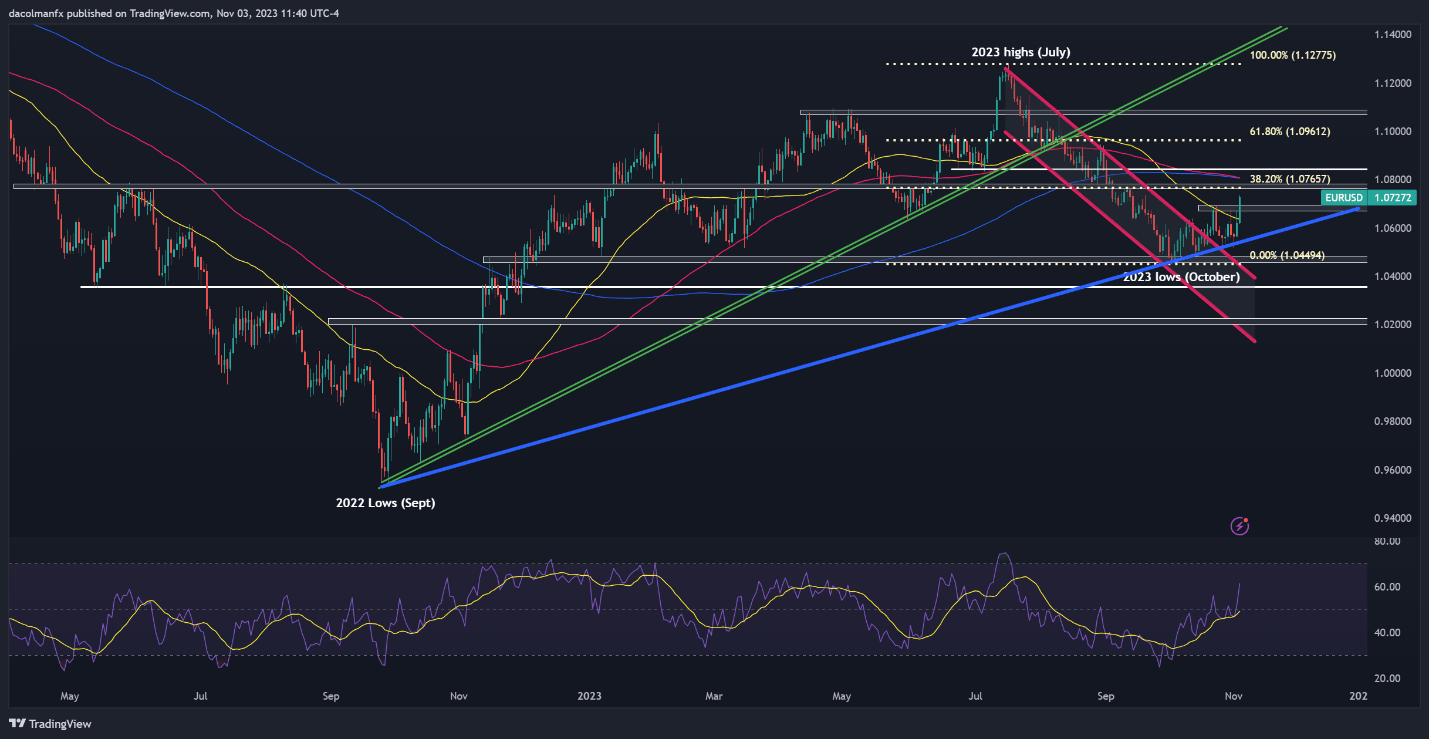
EUR/USD Chart Created Using TradingView
Access a well-rounded view of the Japanese yen's fundamental and technical outlook by securing your complimentary copy of our Q4 trading forecast.

USD/JPY TECHNICAL ANALYSIS
USD/JPY fell on Friday, extending its decline for the third consecutive day after failing to overcome technical resistance near the 152.00 mark. If losses gain impetus in the coming week, support is situated at 148.75. While the pair may have difficulty breaching this area, a clean breakdown could reinforce downside pressure, setting the stage for a descent towards 147.30.
Conversely, if the bullish camp regains control and triggers an upward reversal, overhead resistance spans from 151.95 to 152.00, where this year’s peak aligns with last year’s swing high. In the event of sustained strength, a potential rally towards 153.00 becomes conceivable. This ceiling is created by the upper limit of a medium-term rising channel.
USD/JPY TECHNICAL CHART
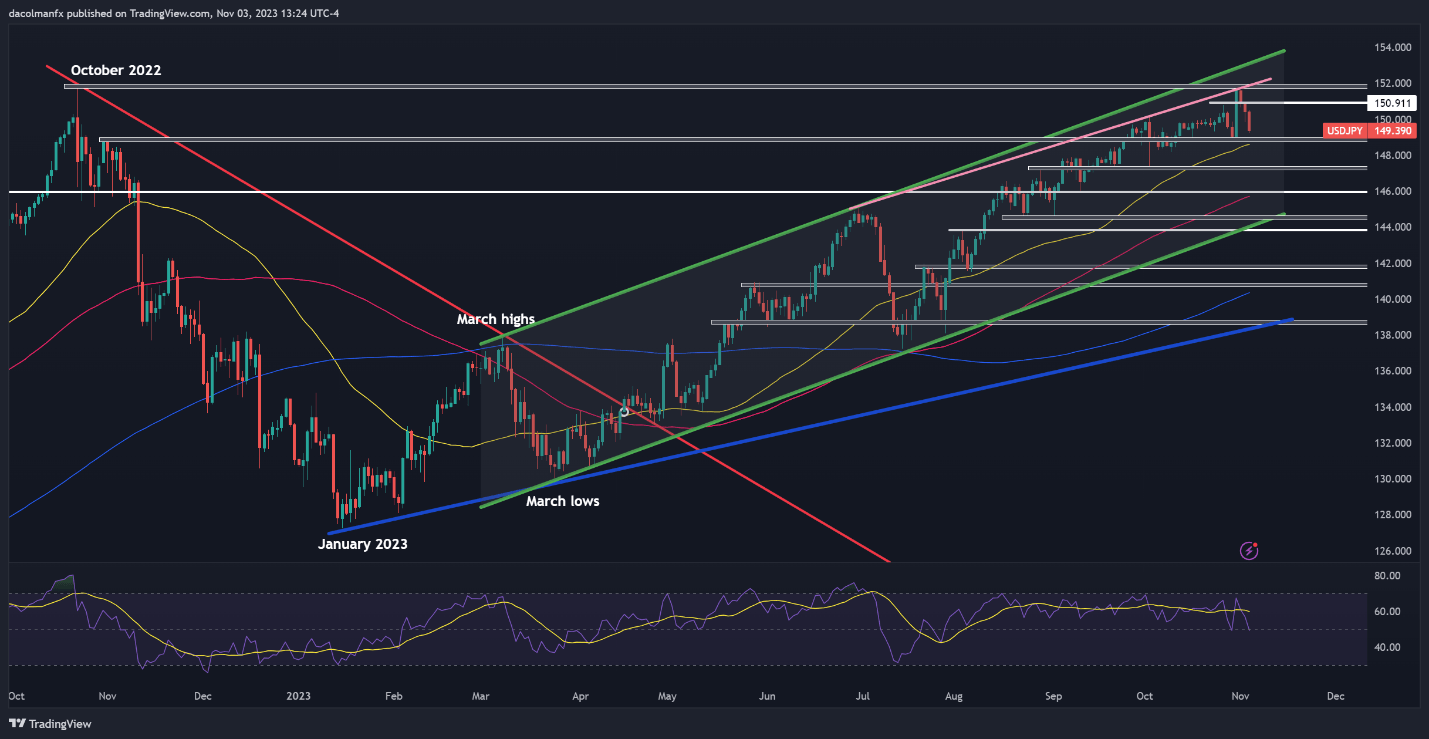
USD/JPY Chart Created Using TradingView
Want to explore the significance of retail positioning in GBP/USD’s price dynamics? Our sentiment guide is your gateway to essential insights. Get your free copy now!
| Change in | Longs | Shorts | OI |
| Daily | -6% | 7% | 0% |
| Weekly | -16% | 6% | -7% |
GBP/USD TECHNICAL ANALYSIS
GBP/USD also broke out on Friday, taking out trendline resistance at 1.2200 and its 50-day simple moving average located around 1.2310. With bullish momentum on cable’s side, gains could accelerate in the coming trading sessions, setting the stage for a possible rally towards 1.2450/1.2460, a key are where the 200-day simple moving average aligns with 38.2% Fib retracement of the July/October pullback.
In contrast, if the buying impetus wanes and allows sellers to stage a comeback, the first area of support to keep an eye on appears at 1.2320/1.2310. Maintaining this technical floor is of utmost importance; failure to do so could open the door for a decline towards 1.2050. On further weakness, we could witness a pullback towards the 1.1800 handle.
GBP/USD TECHNICAL CHART
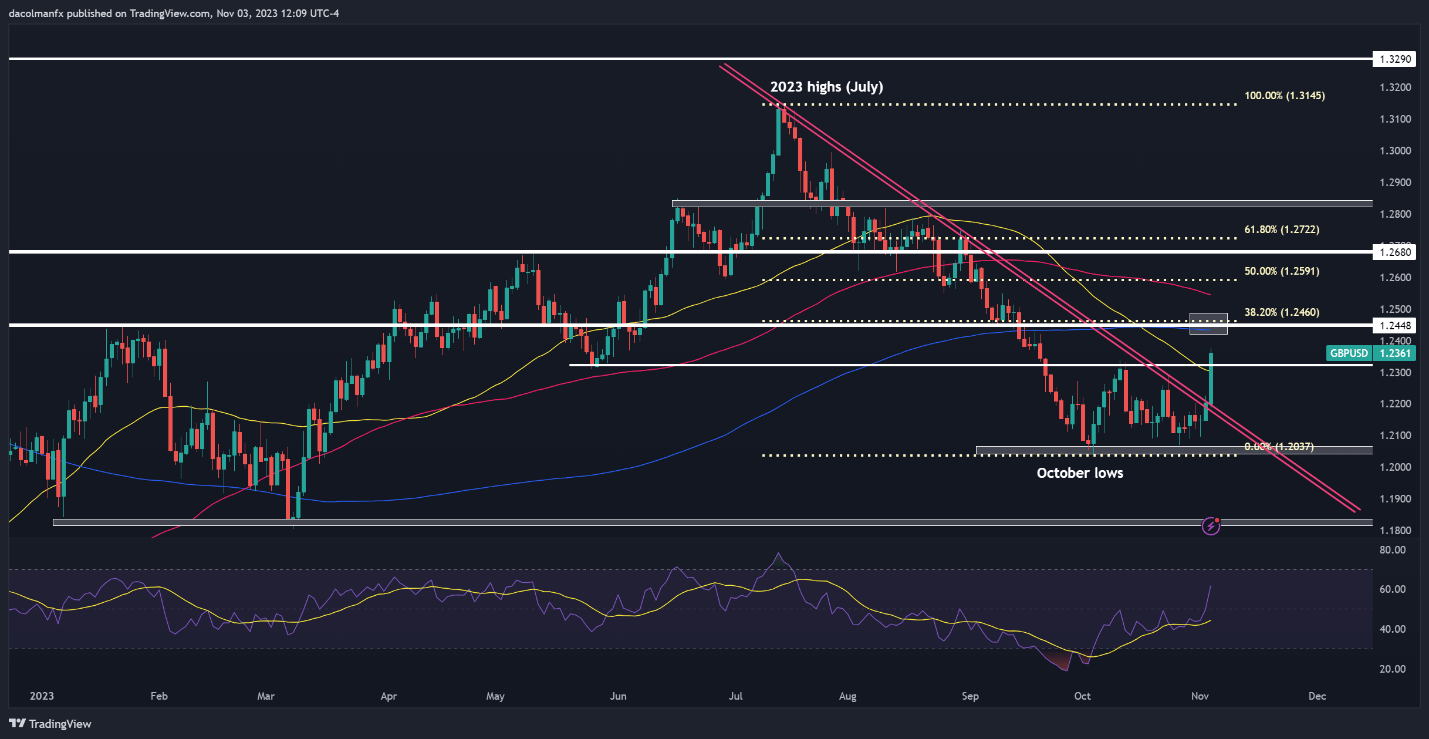
GBP/USD Chart Created Using TradingView
If you're curious about what lies ahead for the Australian Dollar and the important market catalysts to track, download the free Aussie’s quarterly outlook here!

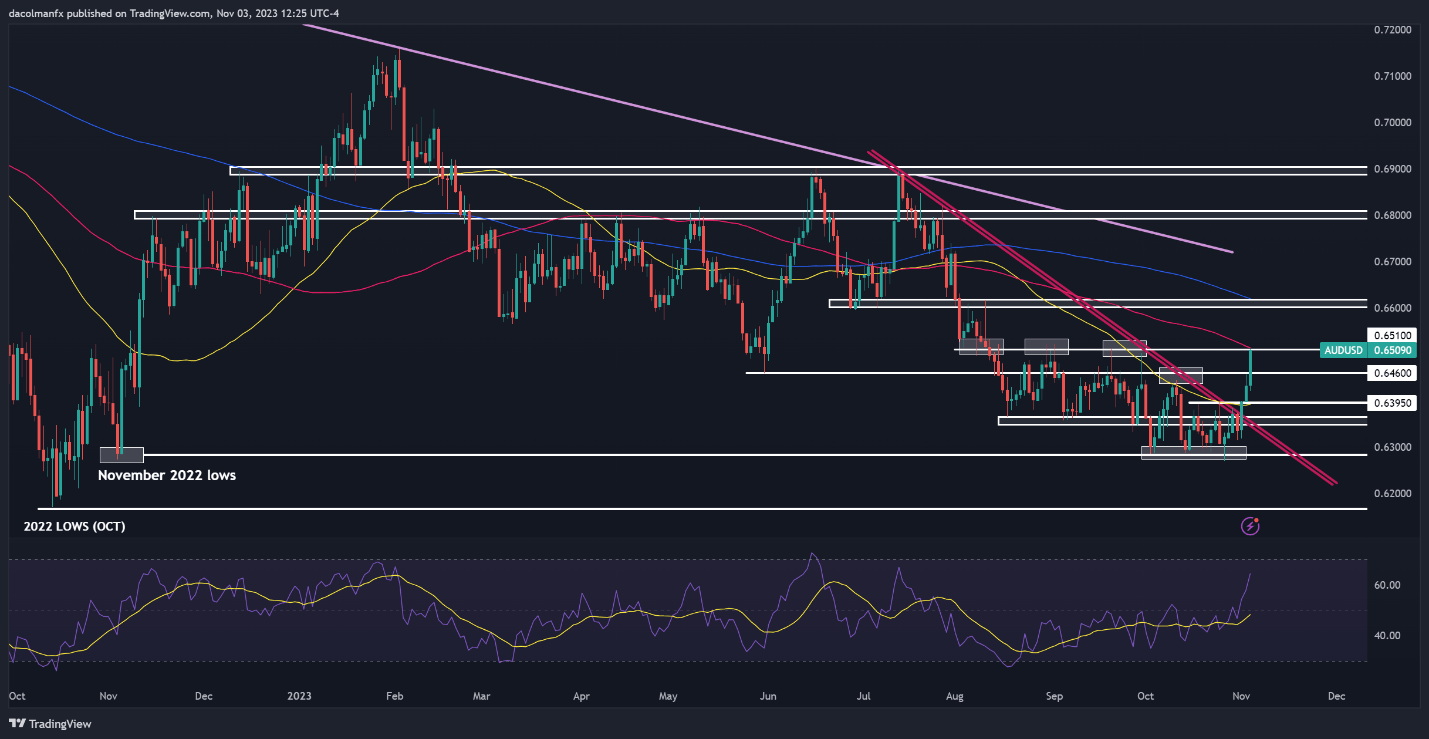
AUD/USD TECHNICAL ANALYSIS
AUD/USD has been on a bullish tear since late October after bouncing off horizontal support hovering around the psychological 0.6300 mark. After recent gains, the pair have managed to clear important technical levels and pushed towards its 100-day simple moving average at 0.6510, the next resistance in play. A break above this ceiling could see a move towards the 0.6600 handle in the near term.
In contrast, if the bears engineer a comeback and reassert market dominance, the first line of defense against a reversal appears at 0.6460. The Australian dollar may establish a base in this area on a pullback, but in the event of a breakdown, a rapid descent towards 0.6395 should not be ruled out entirely. Below this technical floor, the crosshairs will stay on 0.6355.
AUD/USD TECHNICAL CHART