Most Read: Gold Price Outlook Rests on Fed’s Guidance, Nasdaq 100 Breaks Out
The U.S. dollar could face increased volatility in the coming days, courtesy of several high-impact releases on the economic calendar, although the most important risk event for financial markets will likely be the FOMC decision, particularly with the November Consumer Price Index report in the rear-view mirror and behind us.
The Federal Reserve will announce its December monetary policy verdict on Wednesday. Officials are expected to retain the status quo for the third consecutive gathering, keeping borrowing costs in their current range of 5.25% to 5.50%.
In terms of forward guidance, Chairman Powell has indicated that “it would be premature to conclude” that the Fed has achieved a sufficiently restrictive stance, so the institution may be inclined to maintain a tightening bias in its communication for now.
Wondering about the U.S. dollar’s prospects? Gain clarity with our latest forecast. Download a free copy now!

Aside from the official statement, traders should carefully examine the updated “Summary of Economic Projections” to assess whether the central bank’s policy outlook aligns with market’s dovish expectations, which currently envision about 100 basis points of easing over the next 12 months.
In light of the stubbornly sticky inflation profile and the necessity to prevent a further relaxation in financial conditions, the Fed may decide to push back against the aggressive rate cuts discounted for 2024. This scenario could spark a hawkish repricing the central bank’s path, exerting upward pressure on yields and the U.S. dollar.
For a complete overview of the euro’s technical and fundamental outlook, download your complimentary trading forecast now!

EUR/USD TECHNICAL ANALYSIS
EUR/USD exploded higher in November, but has weakened moderately this month, with the exchange rate settling below its 200-day simple moving average in recent days– a bearish technical signal. If the pullback extends, a potential retest of the 50-day SMA could materialize soon. Continued weakness might draw focus towards trendline support, currently traversing the 1.0640 region.
In contrast, if EUR/USD stages a resurgence and trek upwards, technical resistance looms at 1.0830, just around the 200-day SMA. Overcoming this barrier might prove challenging for the bulls, but a breakout could steer the pair towards 1.0960, the 61.8% Fibonacci retracement of the July/October decline. On further strength, the focus shifts to November’s peak.
EUR/USD TECHNICAL CHART
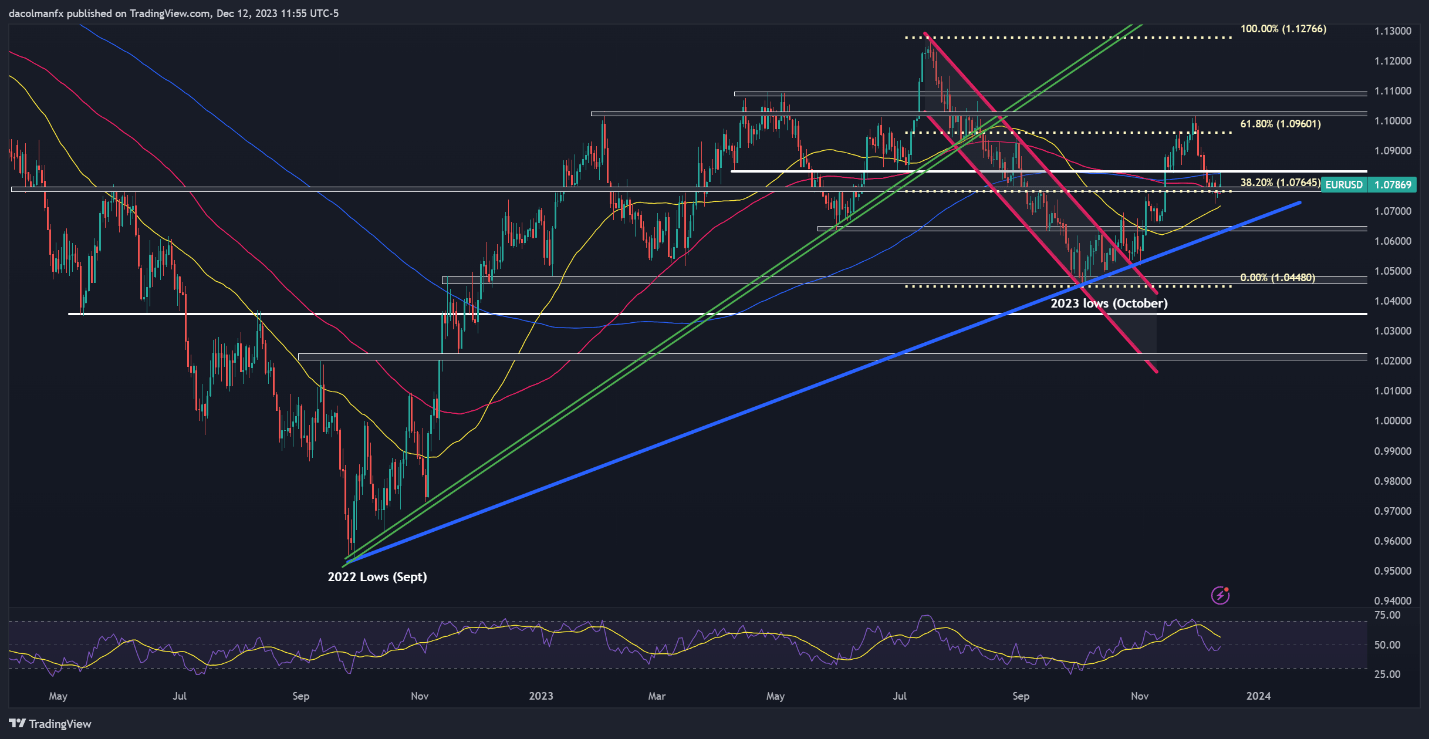
EUR/USD Chart Prepared Using TradingView
Keen to understand the role of retail positioning in GBP/USD’s price action dynamics? Our sentiment guide delivers all the essential insights. Get your free copy now!
| Change in | Longs | Shorts | OI |
| Daily | -6% | 0% | -4% |
| Weekly | -21% | 2% | -12% |
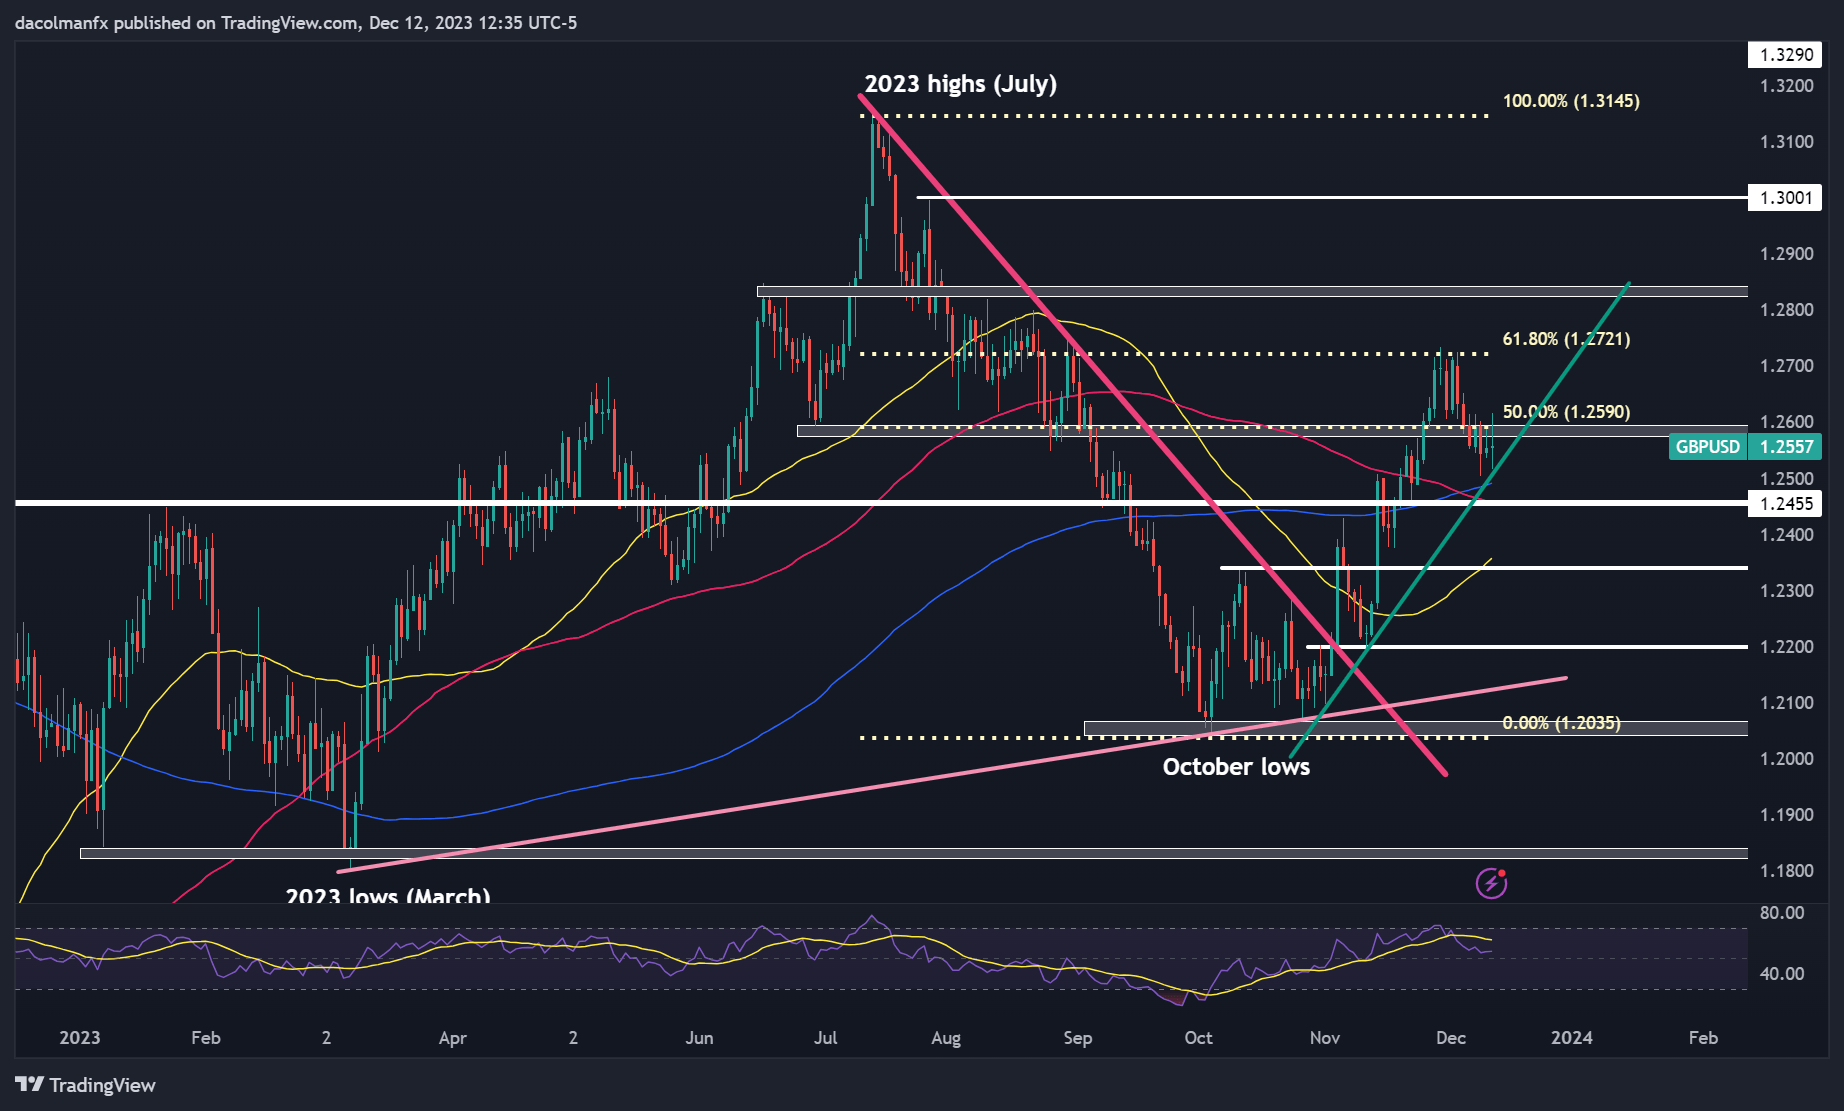
GBP/USD TECHNICAL ANALYSIS
GBP/USD has trended lower in recent days after failing to clear a key ceiling at 1.2720, which represents the 61.8% Fibonacci retracement of the July/October slump. If this downtrend persists, technical support lies near 1.2500, where the 200-day simple moving average converges with a short-term ascending trendline. Further losses could expose the 1.2450 zone.
Conversely, if cable manages to recover from current levels, initial resistance appears at 1.2590. To rekindle bullish sentiment, breaching this technical barrier is crucial – such a move could attract new buyers into the market and drive the pair towards 1.2720. On further strength, attention turns to the 1.2800 handle.
GBP/USD TECHNICAL CHART