
NASDAQ 100, GOLD PRICE FORECAST
- Gold prices and the Nasdaq 100 are poised for heightened volatility in the coming days, with several high-impact events on the calendar later this week
- Market focus will be on the U.S. inflation report on Tuesday and the Fed’s monetary policy announcement on Wednesday
- This article examines gold and the Nasdaq 100’s technical outlook, analyzing sentiment and critical price levels to watch
Trade Smarter - Sign up for the DailyFX Newsletter
Receive timely and compelling market commentary from the DailyFX team
Most Read: US Dollar Forecast - All Eyes on US Inflation, Setups on EUR/USD, USD/JPY, GBP/USD
With this week's economic calendar jam-packed with important releases, volatility will be on the menu for gold prices and the Nasdaq 100 over the next few trading sessions. While there are several high-impact events to follow, the focal point will likely be on Tuesday's U.S. consumer price index data and Wednesday's Fed monetary policy announcement.
Focusing first on inflation, headline CPI is forecast to have flatlined in November, bringing the annual rate to 3.1% from October’s 3.2%. Meanwhile, the core gauge is seen rising 0.3% on a seasonally adjusted basis, with the 12-month related reading unchanged at 4.0%, a sign that the underlying trend remains sticky and uncomfortably high for policymakers.
Since mid-November, interest rate expectations have shifted lower, with traders discounting about 100 basis points of easing over the next 12 months. For this dovish outlook to be validated, CPI figures will have to show that the cost-of-living growth is rapidly converging to the 2.0% target; failure to do so could trigger a hawkish repricing of the Fed’s path – a bearish outcome for precious metals and tech stocks.
Turning to the December FOMC meeting, no changes in rates are anticipated, but the bank could offer hawkish guidance to avoid further relaxation of financial conditions, with odds of this outcome likely increasing in the event of a hotter-than-projected CPI report. If this sequence of events transpires, we could see yields and the U.S. dollar trend upwards, creating a hostile environment for gold and the Nasdaq 100.
Eager to gain insights into gold's outlook? Get the answers you are looking for in our complimentary quarterly trading guide. Request a copy now!

GOLD PRICE TECHNICAL ANALYSIS
Gold (XAU/USD) broke its previous record, briefly reaching an all-time high last week, but was unable to sustain its advance, with the bullish breakout swiftly turning into a large selloff in the days that followed – a sign that sellers have regained the upper hand for now.
While bullion retains a constructive outlook over a medium-term horizon, the yellow metal’s prospects might deteriorate if its value slips below technical support in the $1,965-$1,960 area. This scenario could send prices reeling towards the 200-day simple moving average at $1,950, with a subsequent drop towards $1,930 likely in the case of sustained weakness.
On the other hand, if XAU/USD stabilizes and begins to rebound, the first technical barrier to consider appears at $1,990 and $2,010 thereafter. Sellers are expected to vigorously defend the latter level, but a breakout could open the door for a retest of the $2,050 area. On further strength, the bulls may set their sights on $2,070/$2,075.
GOLD PRICE TECHNICAL CHART
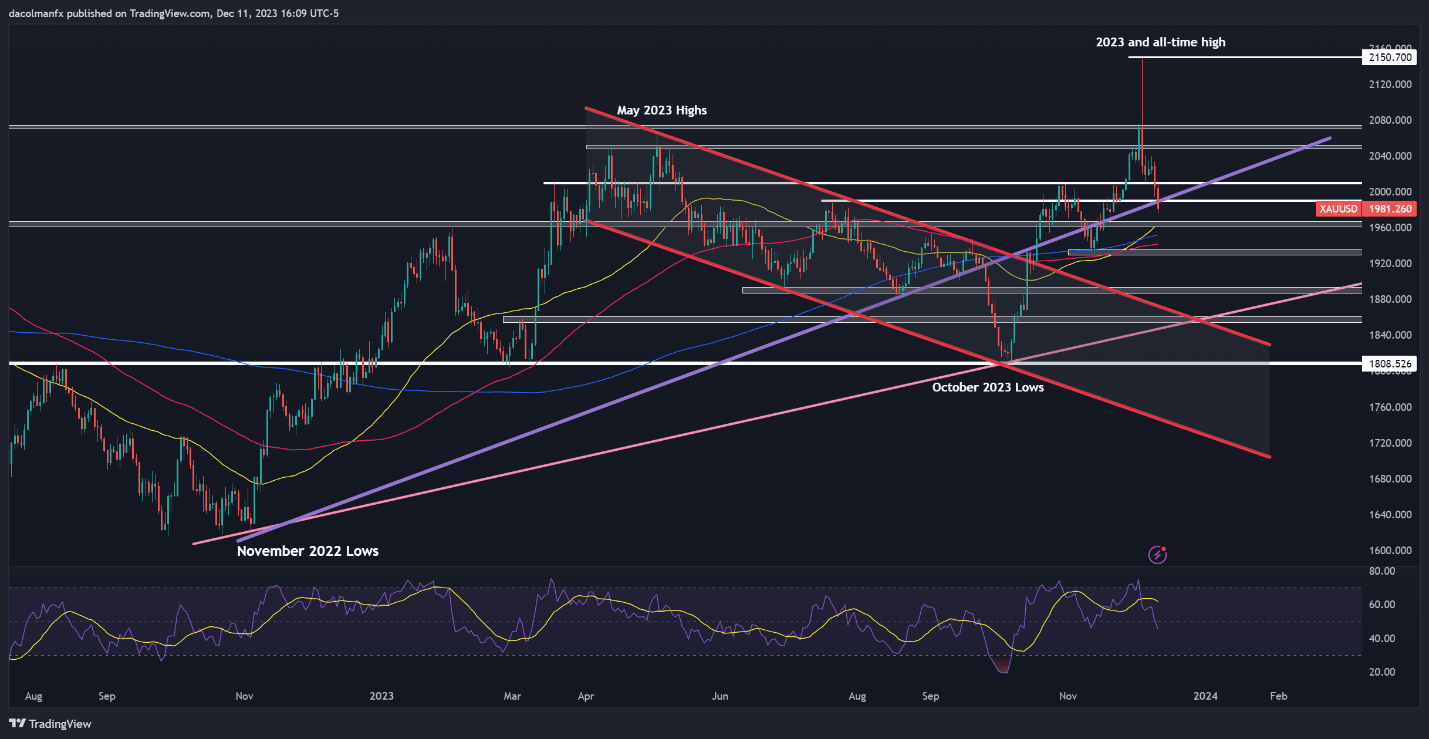
Gold Price Chart Created Using TradingView
Will there be a Santa Rally in the equity market? Find out in our quarterly forecast for equity indices. Download your complimentary guide now!

NASDAQ 100 TECHNICAL ANALYSIS
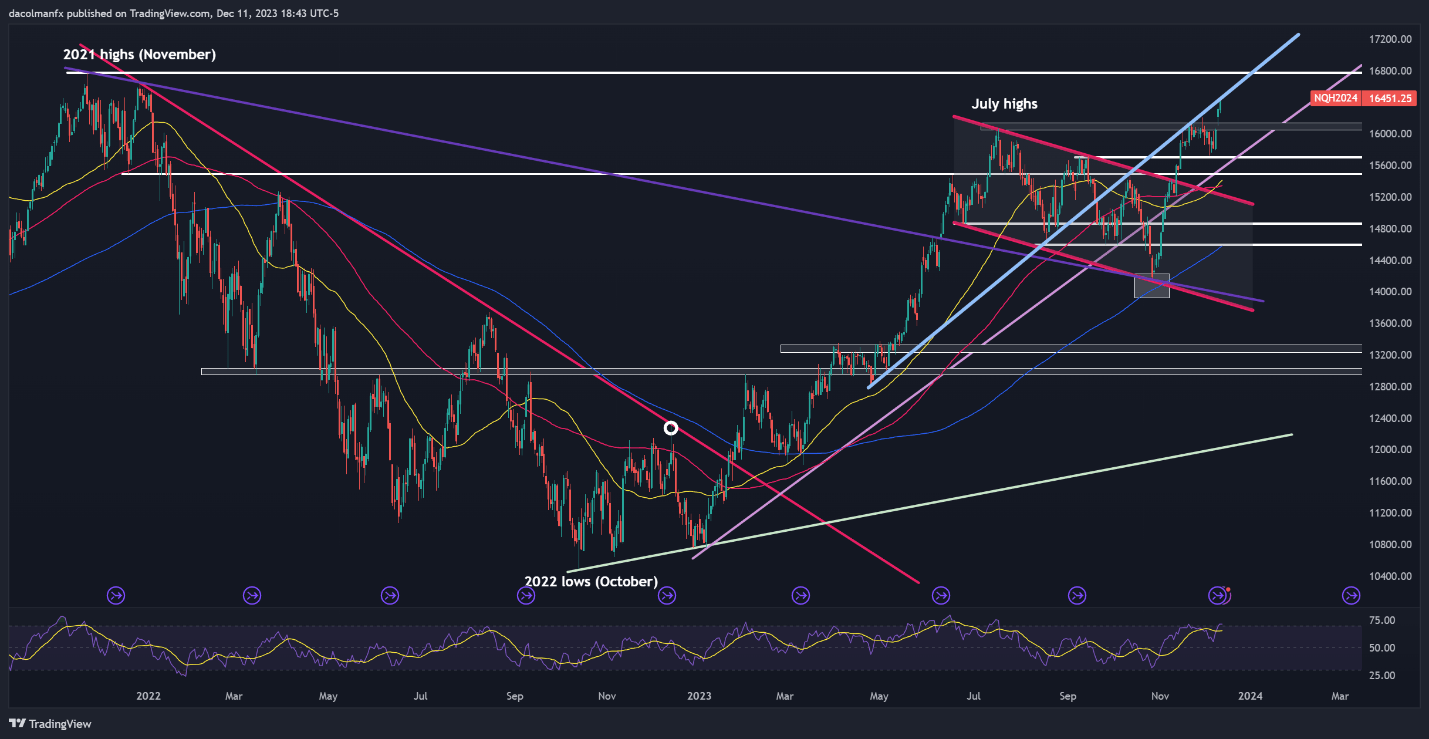
The Nasdaq 100 has breached an important ceiling by decisively blasting past the 16,100 area. If this bullish burst is sustained, the focus will be on trendline resistance at 16,500. With the tech index in overbought territory, a potential rejection at 16,500 is plausible. However, if a breakout materializes, a retest of the all-time high might be imminent.
Conversely, if sentiment swings back in favor of sellers and prices head lower, initial technical support stretches from 16,150 to 16,050. Although this floor may provide some stability during a pullback, a push below this range could set the stage for a drop towards 15,700. On further weakness, sellers may get emboldened to initiate an assault on trendline support near 15,550.
NASDAQ 100 TECHNICAL CHART