USD OUTLOOK – PRICE ACTION SETUPS ON EUR/USD, USD/JPY, GBP/USD
- Higher volatility could be on the menu for the U.S. dollar this week, courtesy of several risk events on the economic calendar
- The November U.S. inflation report will steal the limelight on Tuesday
- This article examines the technical outlook for EUR/USD, USD/JPY and GBP/USD, discussing pivotal price thresholds ahead of U.S. CPI data
Trade Smarter - Sign up for the DailyFX Newsletter
Receive timely and compelling market commentary from the DailyFX team
Most Read: US CPI, Fed Decision to Guide US Dollar, Setups on EUR/USD, USD/JPY, GBP/USD
This week's economic calendar is packed with important releases, so volatility could increase considerably over the next few trading sessions. Although there are several high-impact events to pay attention to, we will focus only on the one that is closest to us: U.S. inflation results due out on Tuesday morning.
Over the past month, U.S. interest rate expectations have shifted lower on bets that the Federal Reserve would move to slash borrowing costs aggressively next year. This scenario, however, likely hinges on inflation falling faster towards 2.0%; otherwise, there would be little appetite among policymakers to loosen policy in a meaningful way.
We will get more clues about the overall trend in consumer prices tomorrow, when the U.S. Bureau of Labor Statistics unveils November’s numbers. According to estimates, headline CPI was flat last month, bringing the annual rate down to 3.2% from 3.1% previously. Meanwhile, the core gauge is seen rising 0.3% m-o-m, resulting in an unchanged 12-month reading of 4.0%.
Wondering about the U.S. dollar’s technical and fundamental outlook? Gain clarity with our latest forecast. Download a free copy now!

UPCOMING US DATA ON TUESDAY
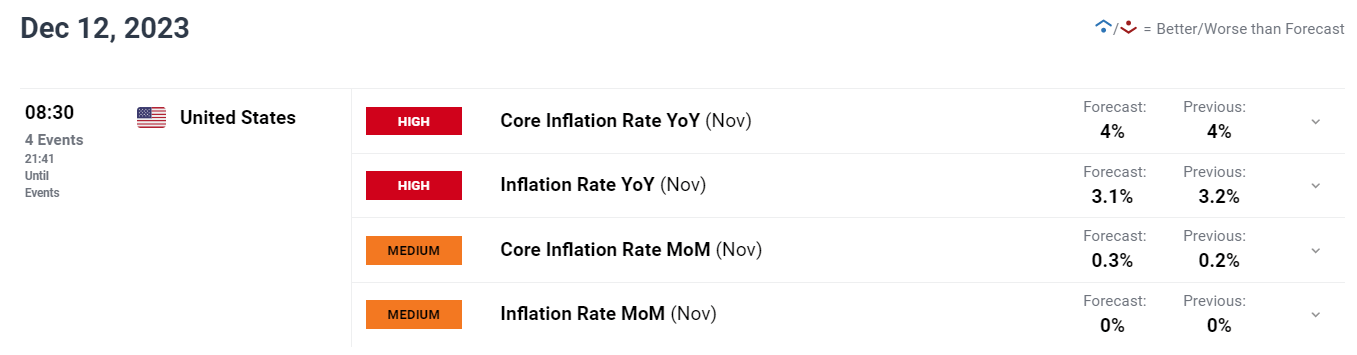
Source: DailyFX Economic Calendar
To validate the dovish monetary policy outlook contemplated by Wall Street, the latest CPI report will have to demonstrate that the cost of living is moderating at a satisfactory pace. Failure to do so could trigger a hawkish repricing of interest rate expectations, pushing U.S. Treasury yields sharply higher and boosting the U.S. dollar.
In summary, an upside surprise in inflation data showing sticky pressures in the underlying trend will be bullish for yields and the U.S. dollar, whereas softer-than-expected numbers could have the opposite effect on markets.
For a complete analysis of the euro’s medium-term prospects, request a copy of our latest forecast!

EUR/USD TECHNICAL ANALYSIS
EUR/USD rose sharply in November, but has sold off this month, with the pair slipping below the 200 and 100-day simple moving averages – a bearish technical signal. Should this pullback persist later this week, a retest of the 50-day SMA could occur at any moment. Further weakness might redirect attention toward trendline support around the 1.0620 mark.
On the flip side, if EUR/USD mounts a comeback and pushes higher, technical resistance appears near 1.0820, but further gains could be in store on a move above this barrier, with the next key ceiling located at 1.0960, the 61.8% Fibonacci retracement of the July/October slump. Sustained strength might prompt a revisit to November’s high points.
EUR/USD TECHNICAL CHART
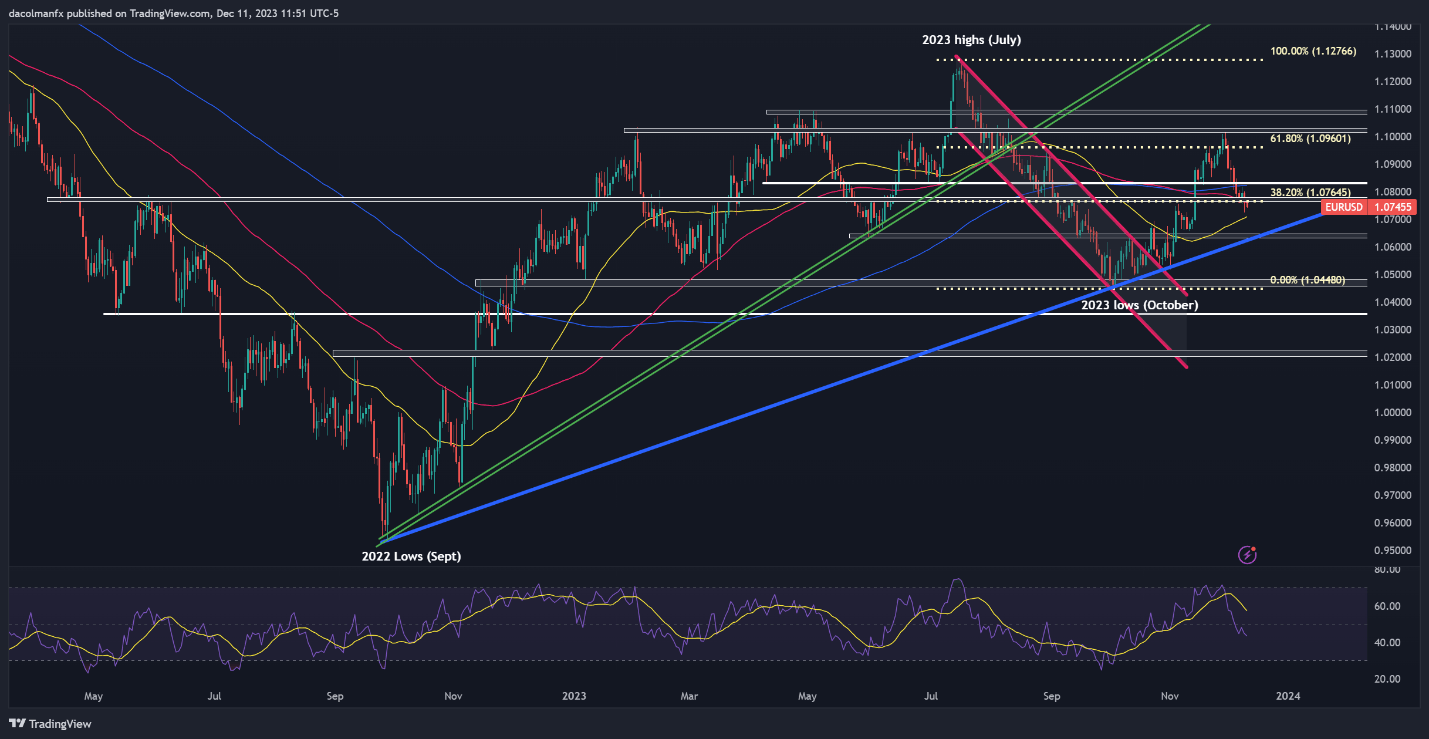
EUR/USD Chart Prepared Using TradingView
Interested in learning how retail positioning can offer clues about USD/JPY’s short-term path? Our sentiment guide has all the answers you seek. Download it now!
| Change in | Longs | Shorts | OI |
| Daily | 3% | 3% | 3% |
| Weekly | 77% | -28% | -8% |
USD/JPY TECHNICAL ANALYSIS
The Japanese yen appreciated significantly against the U.S. dollar last week on speculation that the Bank of Japan would soon end its policy of negative rates. However, the move unwound sharply on Monday, with USD/JPY shooting higher on media reports that the BOJ is not yet fully convinced that wages will grow sustainably to justify the imminent abandonment of its ultra-dovish stance.
If the pair’s rebound extends in the near term, resistance stretches from 147.00 to 147.50. On further strength, the focus shifts to the 50-day simple moving average, followed by 149.90. Conversely, if the bears regain control of the market and spark weakness, initial support rests at 146.00 and 144.50 thereafter. Looking lower, the next key floor to watch appears near 142.30.
USD/JPY TECHNICAL CHART
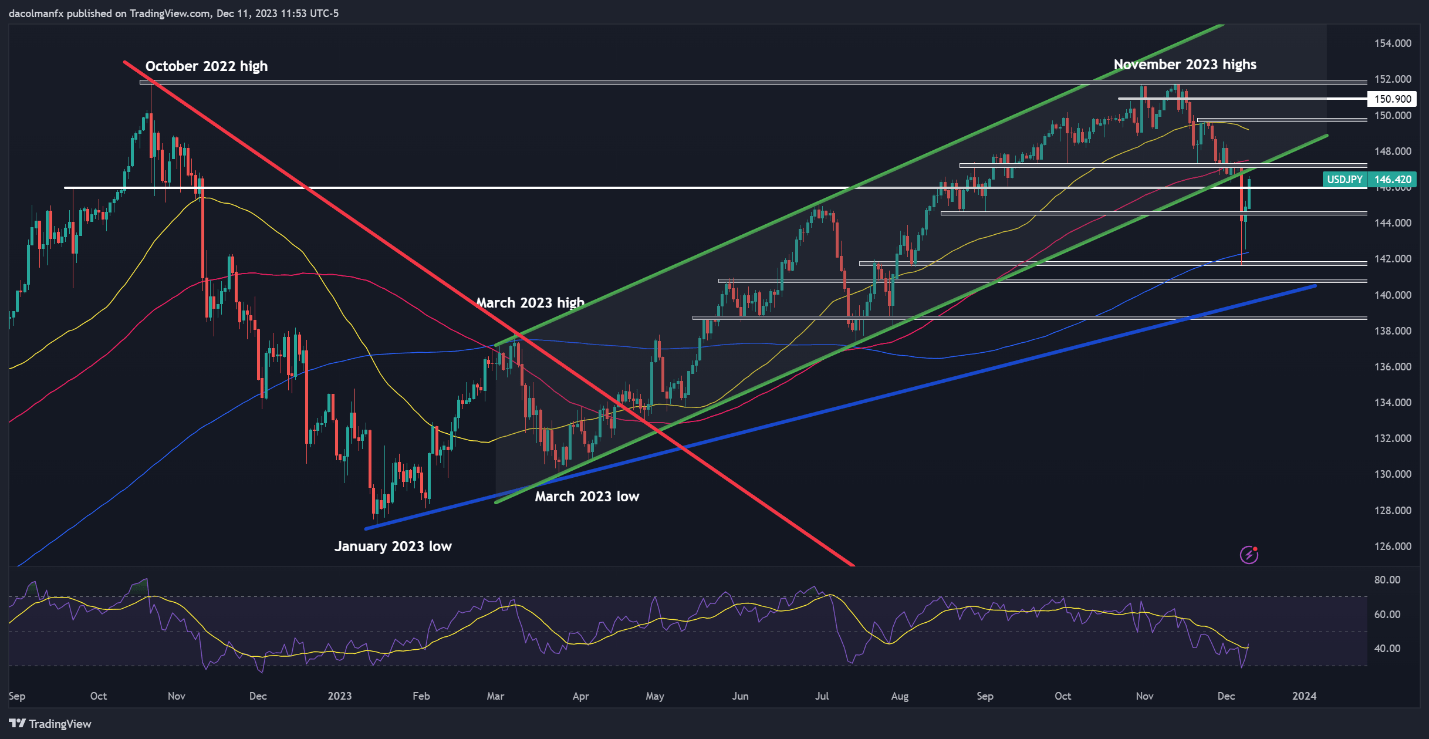
USD/JPY Chart Created Using TradingView
Stay ahead of the curve! Claim your complimentary GBP/USD forecast for a thorough overview of the British pound's prospects!

GBP/USD TECHNICAL ANALYSIS
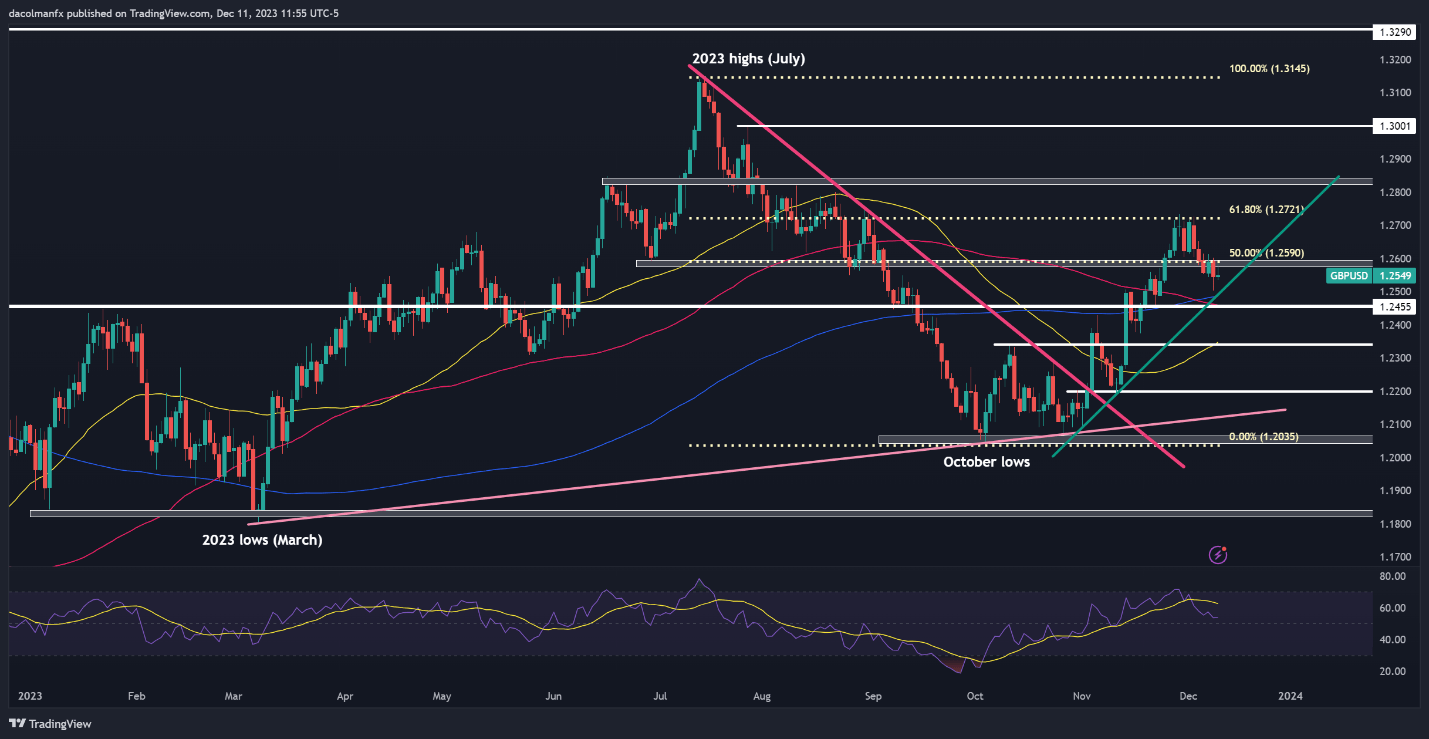
GBP/USD has been on a downward path in recent days after failing to overcome an important ceiling at 1.2720, which corresponds to the 61.8% Fibonacci retracement of the July/October selloff. Should losses continue this week, technical support spans from 1.2500 to 1.2460, where the 200-day simple moving average aligns with a short-term ascending trendline. Further weakness could shift attention to 1.2340.
On the flip side, if cable manages to rebound from its current position, overhead resistance looms at 1.2590. To revive bullish sentiment, the pair must breach this barrier decisively – doing so may attract new buyers into the market, setting the stage for a rally towards 1.2720. Surmounting this barrier might pose a challenge for the bulls, but a breakout could pave the way for an upward move beyond 1.2800.
GBP/USD TECHNICAL CHART