

For a comprehensive assessment of the Japanese yen’s medium-term outlook, make sure to download our technical and fundamental forecast!

USD/JPY TECHNICAL ANALYSIS
While USD/JPY has been on a major bullish run since the beginning of the year, it has trended lower in recent days following several unsuccessful attempts at clearing overhead resistance in the 152.00 region.
After the latest pullback, which has been accelerated by falling U.S. yields, the pair has arrived at the doorsteps of an important floor near 147.25. The integrity of this technical area is vital; failure to maintain it could trigger a drop towards channel support at 146.00. On further weakness, attention shifts to 144.50.
In the event of a bullish turnaround, the first obstacle that could hinder upside progress appears at 149.70. Overcoming this resistance level might prove challenging for the bulls, yet doing so could spark a rally towards 150.90, possibly followed by a retest of this year's high.
USD/JPY PRICE ACTION CHART
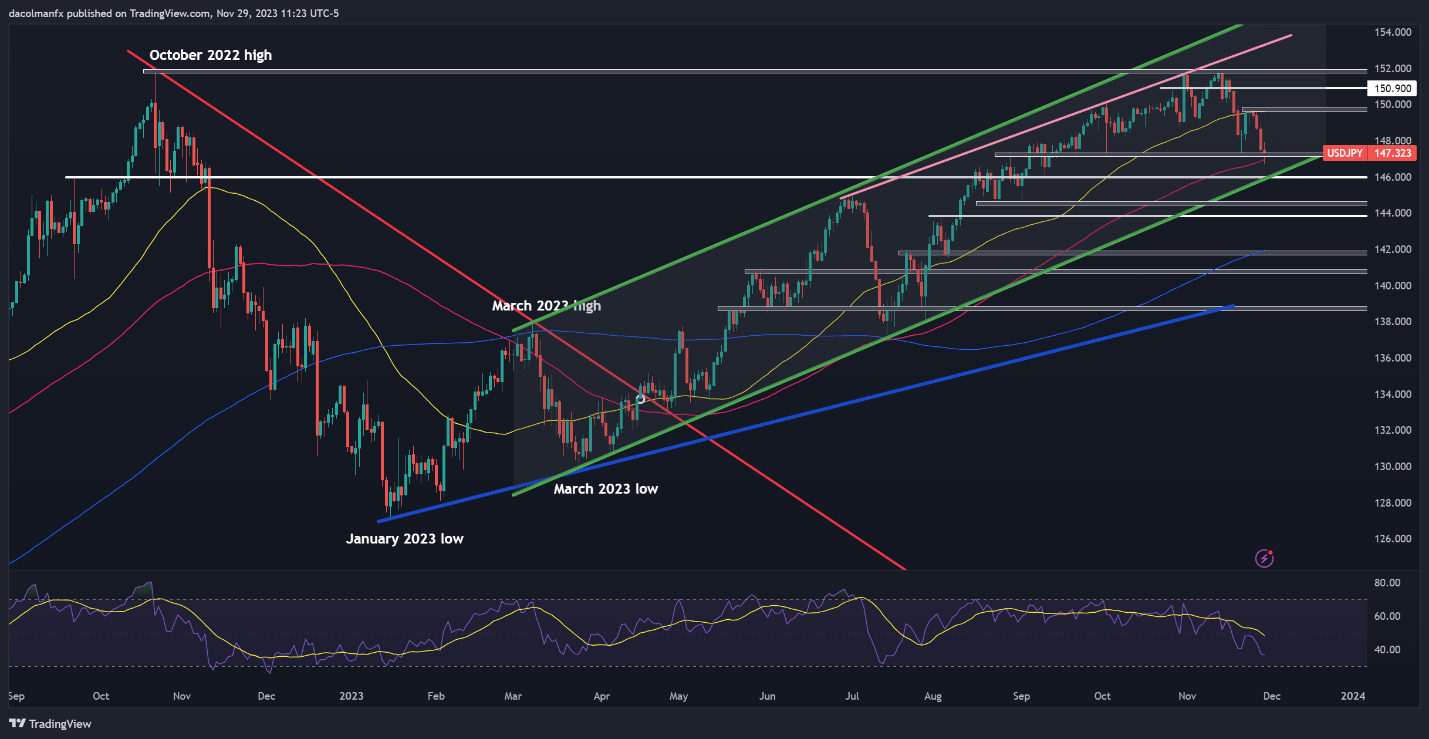
USD/JPY Chart Created Using TradingView
Interested in learning how retail positioning can shape the short-term trajectory of USD/CAD? Our sentiment guide has all the answers. Download your free guide now!
| Change in | Longs | Shorts | OI |
| Daily | -4% | -5% | -5% |
| Weekly | -21% | 1% | -8% |
USD/CAD TECHNICAL ANALYSIS
USD/CAD has also corrected lower this month, but it has started to perk up after encountering support near 1.3570-1.3555, where the 100-day simple moving average converges with a short-term rising trendline. Maintaining this floor will bring stability to the pair and may create the right conditions for a rebound toward 1.3630. Further strength could redirect focus towards the 1.3700 handle.
On the other hand, if USD/CAD resumes its descent and breaks below cluster support stretching from 1.3570 to 1.3555, we may see a drop towards the 200-day simple moving average, just above the psychological 1.3500 mark. Prices could gain a foothold in this area on a pullback, but in the event of a breakdown, a move towards 1.3400 seems very possible.
USD/CAD PRICE ACTION CHART
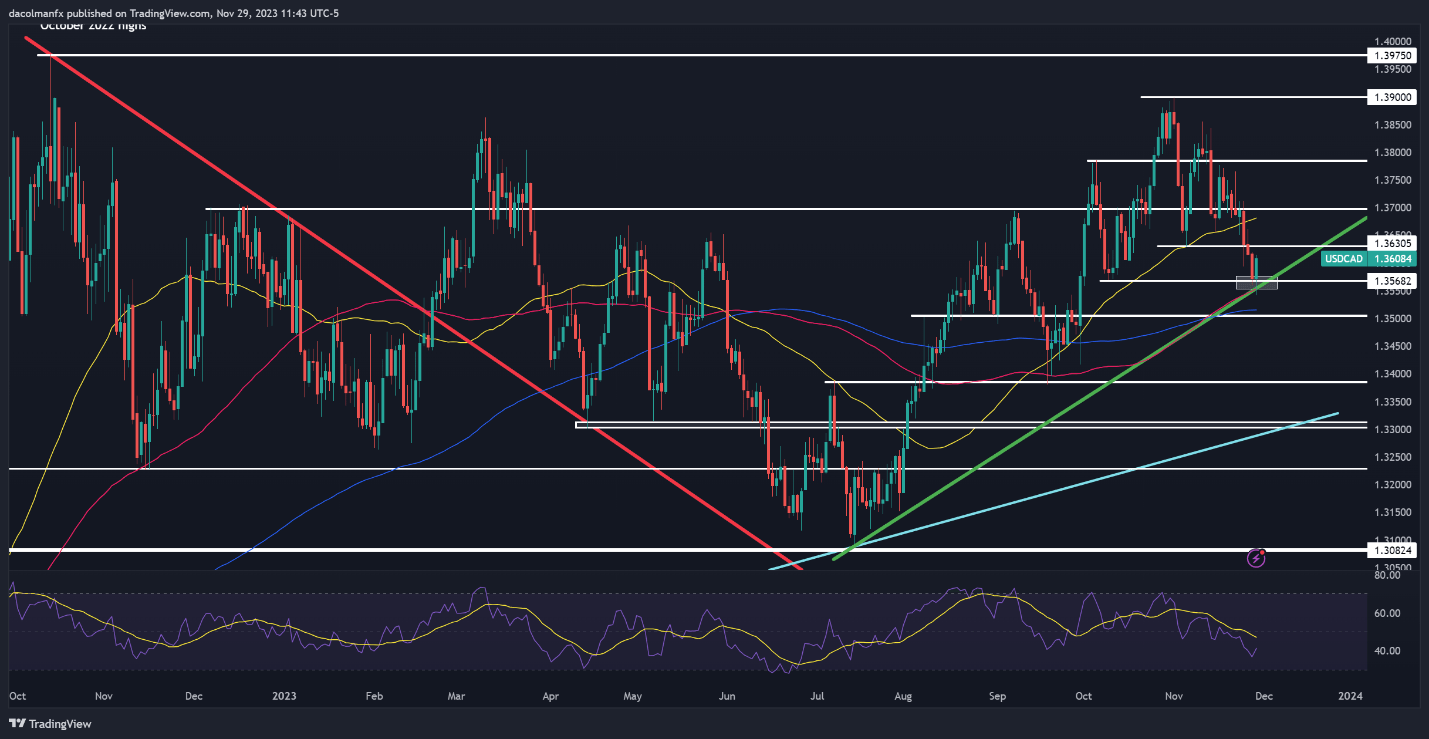
USD/CAD Chart Created Using TradingView
Unsure about the Australian dollar’s trend? Gain clarity with our complimentary Q4 trading forecast!

AUD/USD TECHNICAL ANALYSIS
The downturn in the broader U.S. dollar has benefited the Aussie significantly in recent weeks. For instance, AUD/USD has staged a solid rally in November, briefly touching its strongest level since early August during the overnight session.
While AUD/USD retains a constructive short-term bias, solidifying confidence in the bullish outlook requires a decisive move above trendline resistance at 0.6675. Given the pair’s overbought conditions in recent days, this scenario may take some time to develop, but an abrupt and unexpected breakout could still propel the exchange rate towards the 0.6800 handle.
Conversely, if upward pressure fades and sellers regain decisive control of the market, primary support rests at 0.6620/0.6600 and then 0.6580, near the 200-day simple moving average. On further weakness, we could see a retrenchment towards 0.6525.
AUD/USD PRICE ACTION CHART