
CANADIAN DOLLAR OUTLOOK:
- USD/CAD has lacked directional conviction over the past week, with the pair stuck in a consolidation phase
- While ranging market can be predictable, traders should also consider breakout scenarios
- This article looks at USD/CAD’s key tech levels to watch in the coming days

Most Read: Japanese Yen Q3 Technical Forecast - USD/JPY and EUR/JPY on Bullish Paths
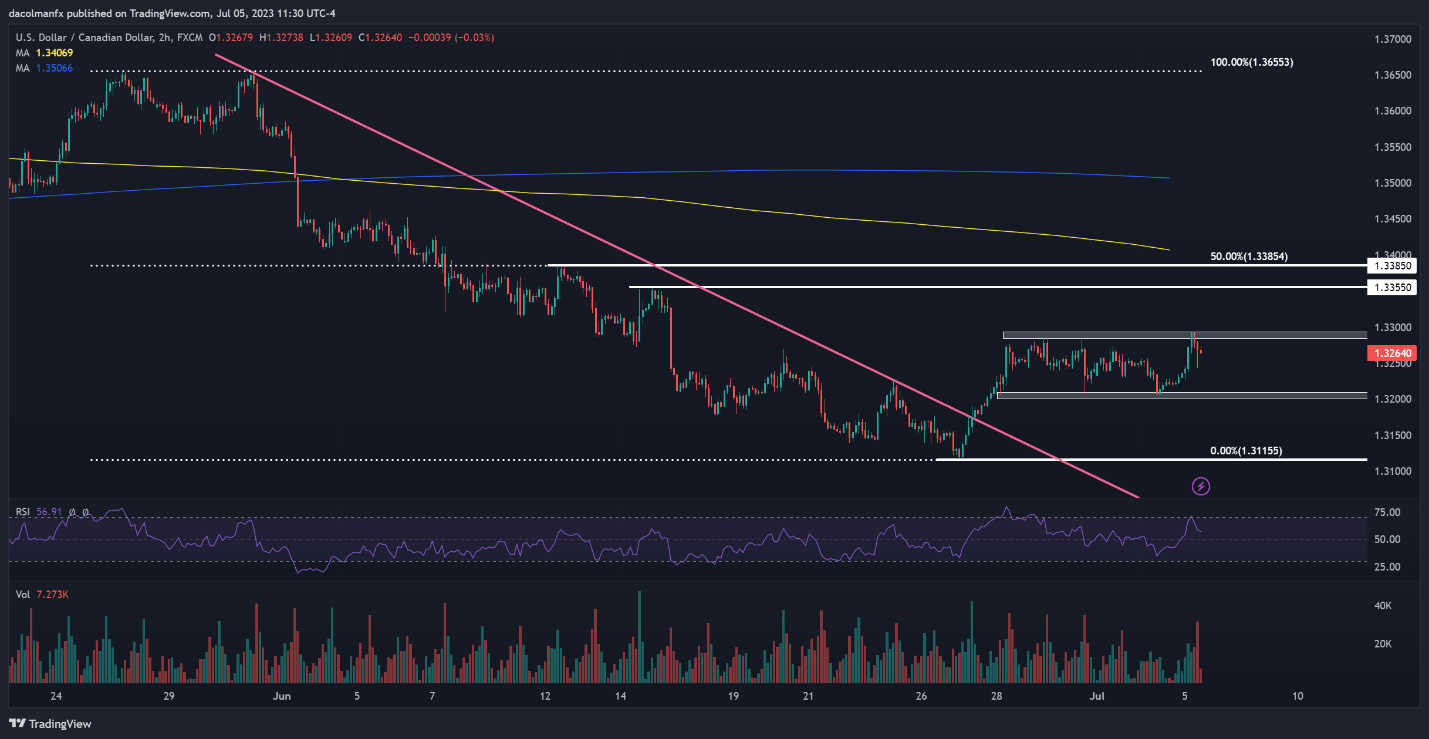
USD/CAD has been rangebound since last week, trading largely sideways within the confines of a lateral channel, with its lower limit around 1.3210 (support) and its upper boundary near 1.3285 (resistance).
During periods of consolidation and limited volatility, range trading setups can be effective and easy to execute. These strategies consist of first identifying the interval in which the asset in question has recently traded before placing bullish or bearish bets.
After pinpointing key technical levels, the idea is to position for a pullback at resistance or to go long at support ahead of a possible rebound.
Looking at the two-hour chart, USD/CAD appears to be approaching 1.3285 - the ceiling of the horizontal corridor it has been stuck in for the past seven days or so. If history is a guide, prices could be rejected from this region, paving the way for market weakness and a potential retest of 1.3285.
Conversely, if USD/CAD pushes higher and clears overhead resistance at 1.3285, the range trading configuration would be invalidated. This scenario could create the right conditions for a move towards 1.3355, followed by 1.3385, especially if the breakout is accompanied by higher volume.
| Change in | Longs | Shorts | OI |
| Daily | 9% | -12% | -2% |
| Weekly | 23% | -14% | 3% |
USD/CAD TECHNICAL CHART