GOLD OUTLOOK & ANALYSIS
- Core PCE data keeps pressure on USD as gold soars.
- Jobless claims data in focus next week.
- Can gold bulls hold on above $2050?
Elevate your trading skills and gain a competitive edge. Get your hands on the Gold Q4 outlook today for exclusive insights into key market catalysts that should be on every trader's radar.

XAU/USD FUNDAMENTAL FORECAST
Gold prices finally breached the $2050 level after threatening since mid-December after US PCE deflator readings missed forecasts. The core metric (Fed’s preferred inflation gauge) dropped to levels last seen in April 2021 and the first negative MoM print in over 3 years. Implied Fed funds futures below now prices in almost 160bps of cumulative rate cuts in 2024 with the first cut becoming more convincing in Q1. That being said, Durable goods orders and Michigan consumer sentiment have improved significantly and shows the resilience of the US economy in the current restrictive monetary policy environment. Jobless claims data continues to resist doves and will be closely monitored next week.
IMPLIED FED FUNDS FUTURES
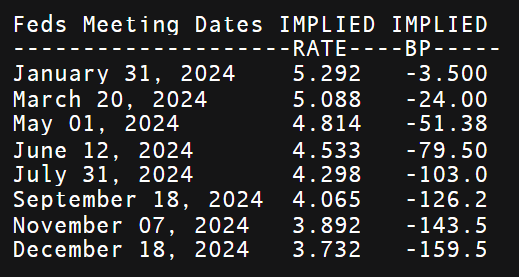
Source: Refinitiv
The upcoming week (see economic calendar below) is unlikely to provide any drastic market moves as the last trading week of 2023 contains no high impact economic data and will likely remain rangebound. It is important to keep a close eye on external risk events such as the ongoing war in both Ukraine and Gaza. Any notable escalation could prompt a move to safety and bring gold bulls into play.
GOLD ECONOMIC CALENDAR
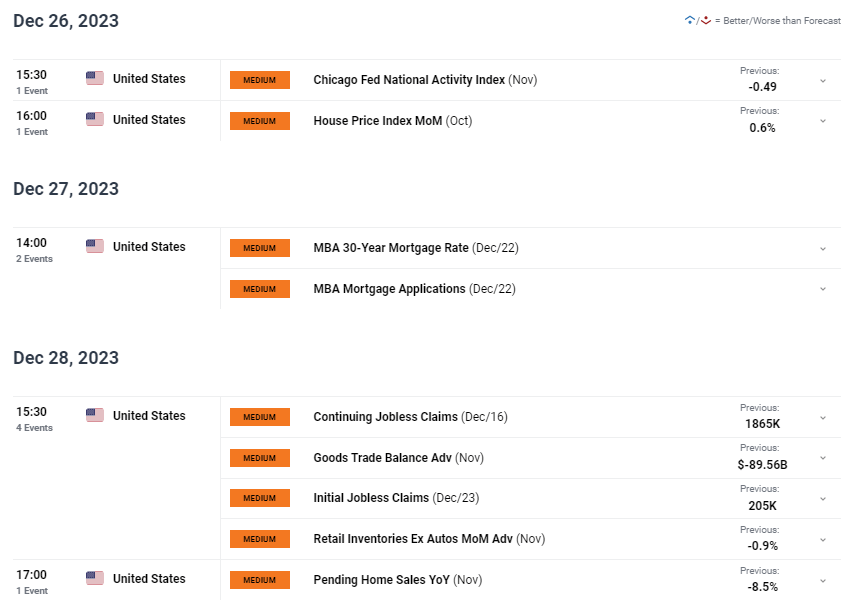
Source: DailyFX
Want to stay updated with the most relevant trading information? Sign up for our bi-weekly newsletter and keep abreast of the latest market moving events!
Trade Smarter - Sign up for the DailyFX Newsletter
Receive timely and compelling market commentary from the DailyFX team
TECHNICAL ANALYSIS
GOLD PRICE DAILY CHART
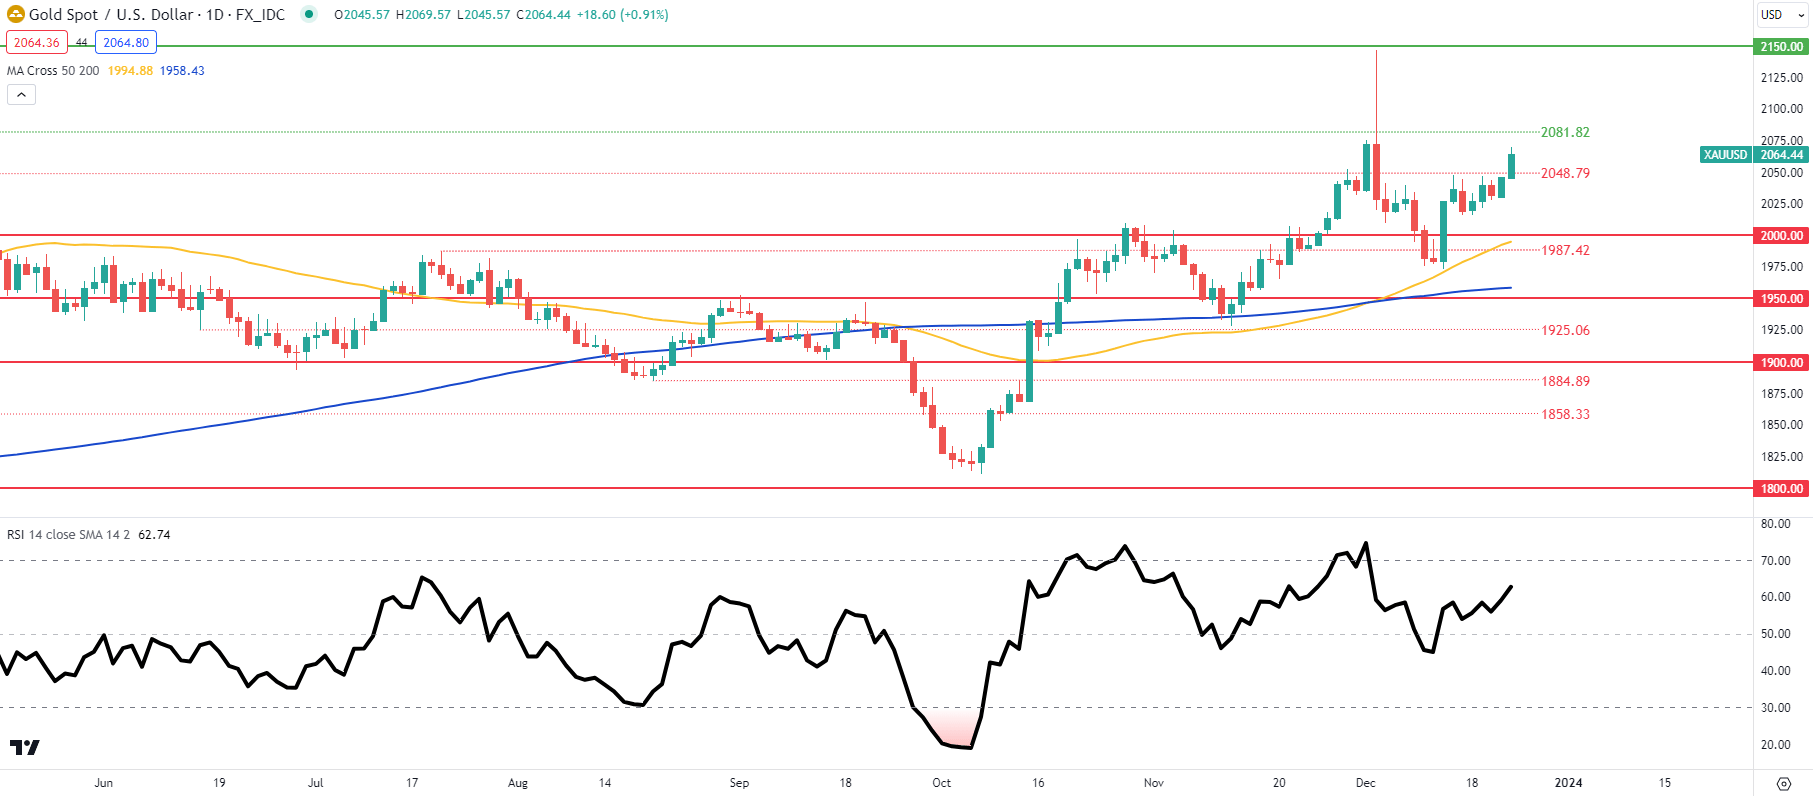
Chart prepared by Warren Venketas, TradingView
The daily XAU/USD chart above sees bulls looking to retest the overbought zone on the Relative Strength Index (RSI). As mentioned above, with minimal volatility expected over the coming week, prices may remain around current levels.
Resistance levels:
- 2150.00
- 2081.82
Support levels:
- 2048.79
- 2000.00
GOLD IG CLIENT SENTIMENT: BULLISH
IGCS shows retail traders are currently net LONG on GOLD, with 60% of traders currently holding long positions.
Curious to learn how market positioning can affect asset prices? Our sentiment guide holds the insights—download it now!
| Change in | Longs | Shorts | OI |
| Daily | 8% | -8% | 0% |
| Weekly | 11% | -9% | 1% |
Contact and followWarrenon Twitter:@WVenketas