


GOLD (XAU/USD) KEY POINTS:
- Gold (XAU/USD) Eyes a Retest of the 100-Day MA Helped by a Weaker US Dollar.
- Range Remains in Play Between the $1890 and $1945 Handles Respectively.
- Falling Wedge Pattern Hints at a Potential Bullish Breakout.
- To Learn More About Price Action, Chart Patterns and Moving Averages, Check out the DailyFX Education Section.
Trade Smarter - Sign up for the DailyFX Newsletter
Receive timely and compelling market commentary from the DailyFX team
READ MORE: USD/JPY, EUR/JPY Price Forecast: Intervention Concerns Provide Optimism for Yen Bulls
Gold prices continued its recovery in the European session as the Independence Day Holiday in the US has left the US Dollar on the back foot. As the US session approaches prices could struggle in the absence of liquidity with the FOMC minutes and NFP still to come this week. An increase in probability of a 25bps hike from the Fed in July has done little to quell the recent rally in Gold prices.
Markets are pricing in an 86.2% probability that the Federal Reserve will deliver a 25bps at the July 26 meeting, up from 53.5% a month ago and 76% a week ago. Despite the increase in rate hike probabilities, we have also seen increased fear around a potential recession as manufacturing data over the past week has been particularly atrocious. This could in theory partly explain the resurgence in gold prices following a brief stint below the $1900/oz psychological level.
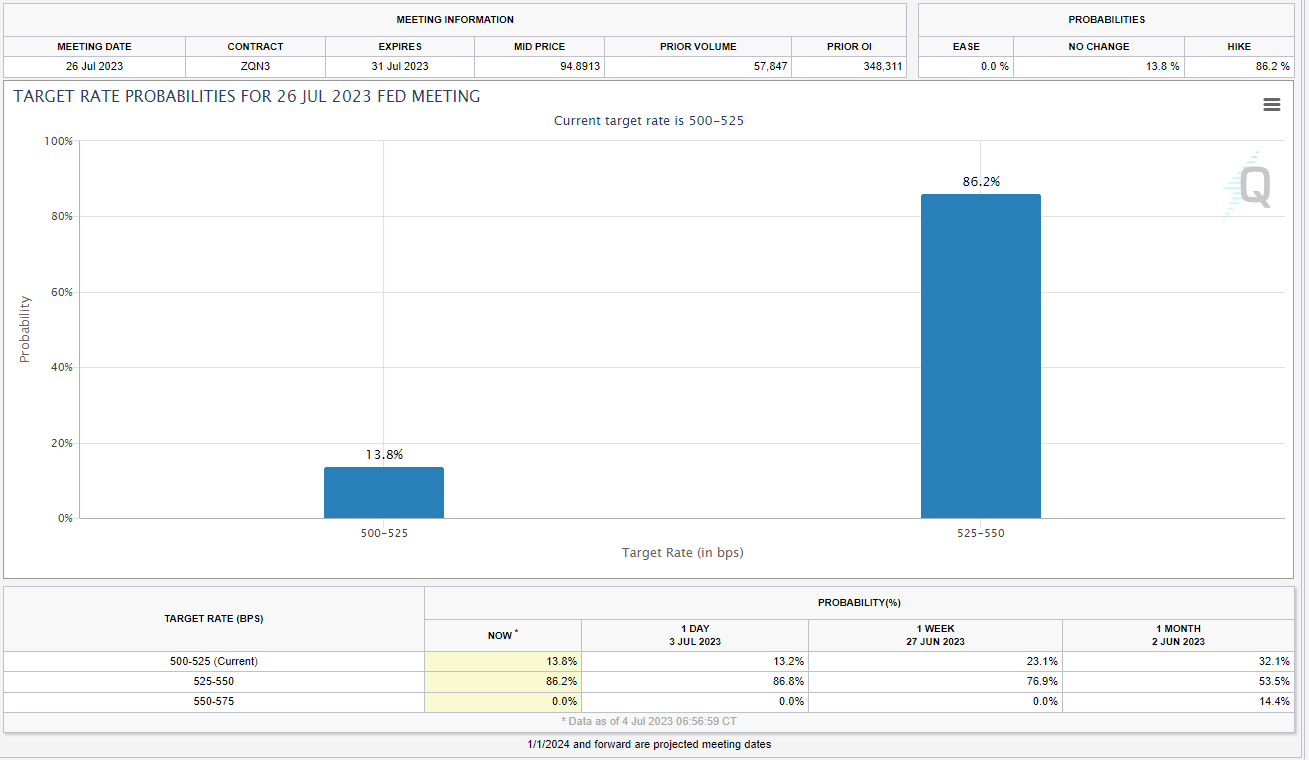
Source: CME FedWatch Tool
As mentioned with the US holiday there isn’t a lot expected in the US session with price likely to remain within the daily range, between the $1918-$1930/oz handles. Market participants will no doubt be looking toward the FOMC minutes release on Wednesday for a potential catalyst that could initiate a breakout of the larger range in play between the $1890 and $1945 levels respectively.

For all market-moving economic releases and events, see the DailyFX Calendar
Foundational Trading Knowledge
Commodities Trading
Recommended by Zain Vawda
TECHNICAL OUTLOOK AND FINAL THOUGHTS
Form a technical perspective, Gold price action has been printing lower highs and lower lows with the 100-day MA remaining a key area of resistance likely to cap any attempted move to the upside. Last week’s breach of the $1900 handle failed to find acceptance with the precious metal recovering rather quickly. As long as recessionary fears remain in play Gold could in theory remain supported as its safe haven appeal grows. A daily candle close below the $1900 level is needed if we are to see further downside for gold prices while at this stage the 100-day MA around the $1945 handle holds the key for bulls as they attempt another run at the $2000 mark.
There is a falling wedge pattern in play on the daily chart below which would hint at a bullish breakout rather than a bearish one. As mentioned, the first sticking point to any upside move will be the 100-day MA before the $1975 and $2000 handles come into focus.
Gold (XAU/USD) Daily Chart – July 4, 2023
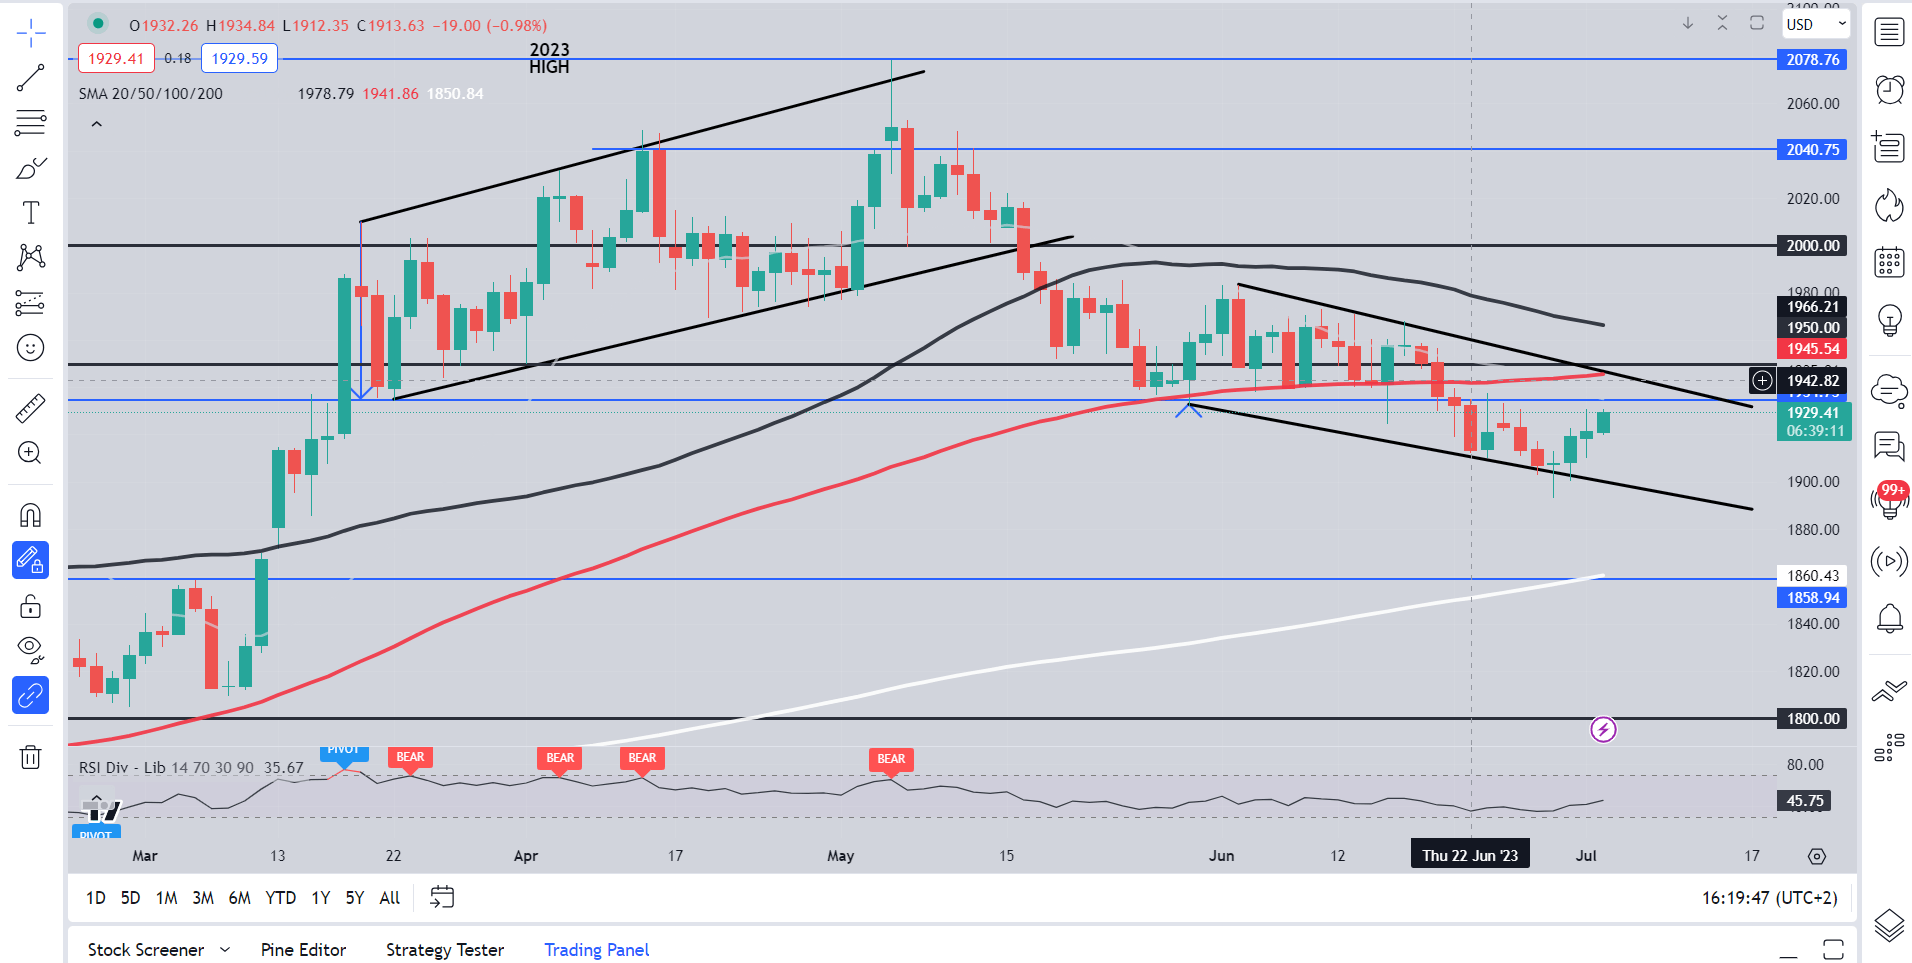
Source: TradingView, Chart Prepared by Zain Vawda
IG CLIENT SENTIMENT DATA
Taking a look at the IG client sentiment data and we can see that retail traders are currently net LONG on Gold with 68% of traders holding long positions (as of this writing). At DailyFX we typically take a contrarian view to crowd sentiment meaning we could see Gold prices continue to decline following a short upside rally.
Written by: Zain Vawda, Markets Writer for DailyFX.com
Contact and follow Zain on Twitter: @zvawda


