
For a comprehensive analysis of the euro’s medium-term prospects, request a copy of our Q1 forecast!

EUR/JPY TECHNICAL ANALYSIS
EUR/JPY regained lost ground last week after bouncing off trendline support and the 200-day simple moving average, but its recovery stalled when prices failed to clear a major ceiling around the 158.75 mark, a rejection that triggered a modest pullback in recent sessions.
While the longer-term outlook for the pair remains constructive, prolonged trading below 158.75 could signal an exhaustion of upside momentum, a condition that could usher in a move towards 156.75. Continued weakness might prompt a revisit of the 155.40 region.
In the event of a bullish reversal, overhead resistance looms at 158.75, as noted above. For bullish impetus to resurface, this technical zone must be taken out decisively, with this scenario poised to trigger a rally towards the 160.00 handle. On further strength, the focus turns to 161.25.
EUR/JPY TECHNICAL CHART
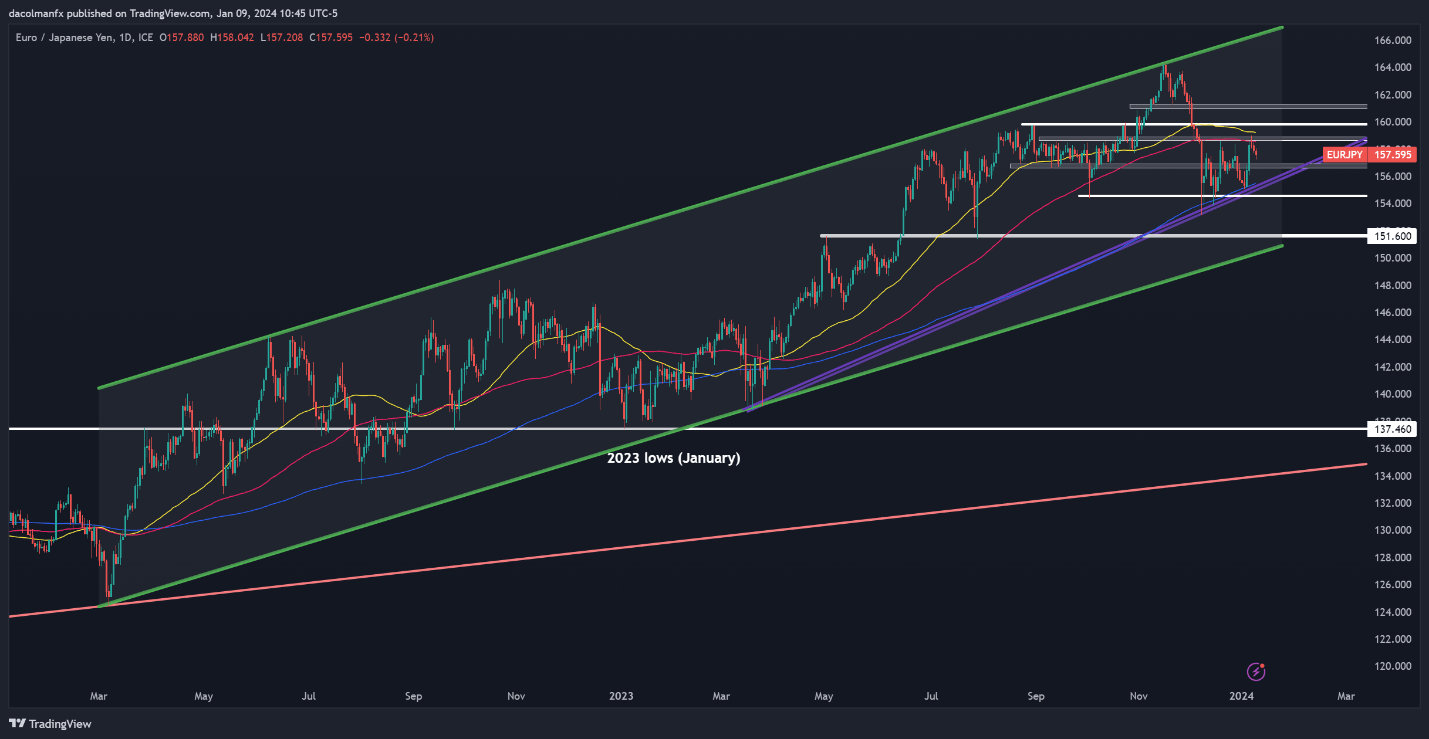
EUR/JPY Chart Created Using TradingView
Interested in learning how retail positioning can give clues about the short-term trajectory of GBP/JPY? Our sentiment guide has all the answers you are looking for. Download it now!
| Change in | Longs | Shorts | OI |
| Daily | 4% | -13% | -10% |
| Weekly | -21% | -3% | -8% |
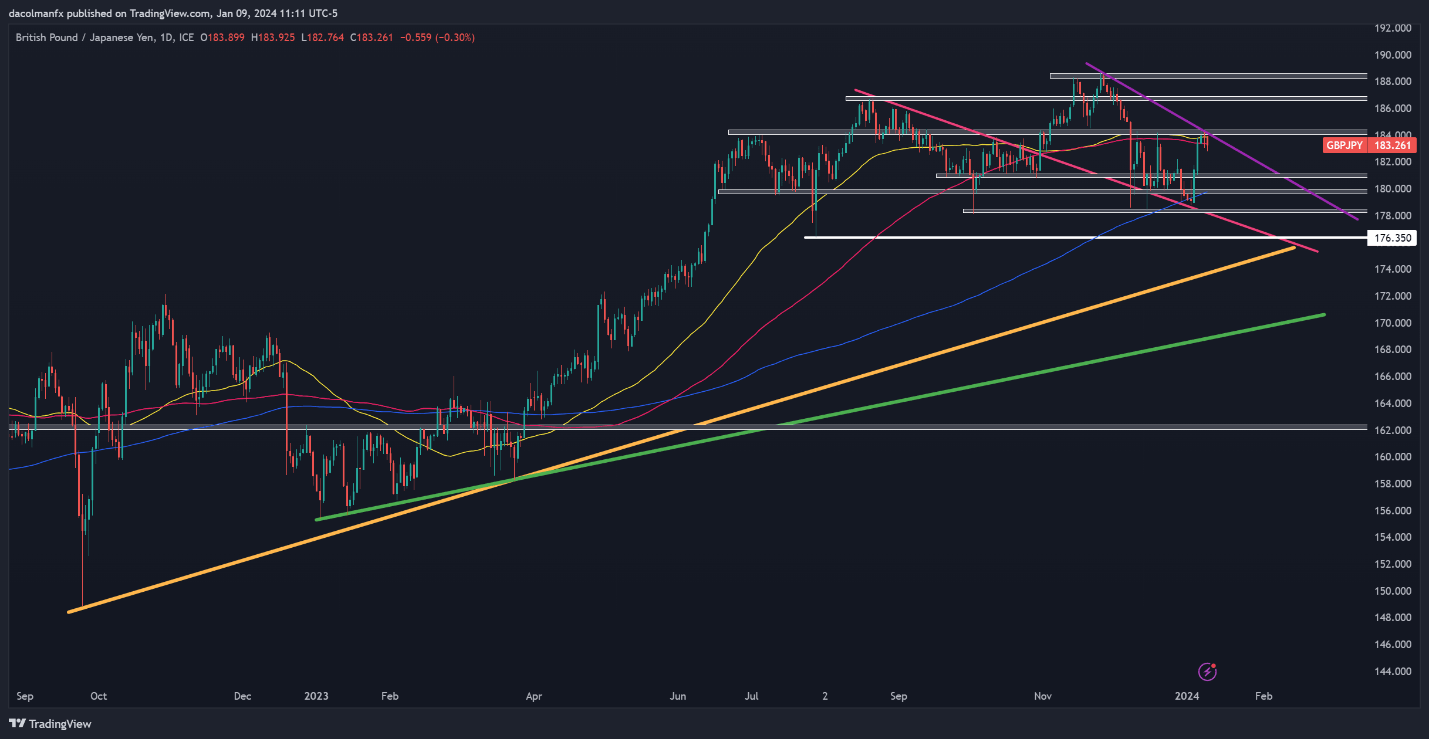
GBP/JPY TECHNICAL ANALYSIS
GBP/JPY staged a strong rally and climbed nearly 2.5% last week, but bullish momentum has started to wane over the past few days after an unsuccessful attempt at overtaking cluster resistance around the psychological 184.00 level, as shown in the daily chart below.
It is still uncertain whether the 184.00 ceiling can contain bullish progress for much longer, but if it does, sellers are likely to slowly reemerge, paving the way for a retracement towards the 181.00 handle. Below this floor, all eyes will be on the 200-day simple moving average near 180.00.
Conversely, if the bulls retake decisive control of the market and manage to propel prices past the 184.00 handle, the next critical resistance to watch is positioned around 186.75. Successfully piloting above this barrier could open the door to a retest of the 2023 highs.
GBP/JPY TECHNICAL CHART