


USD/CAD ANLAYSIS & TALKING POINTS
- Crude oil to be closely monitored after large decline.
- US CPI central to Fed expectations.
- Long upper wick & bearish divergence couple to provide downside bias.
Want to stay updated with the most relevant trading information? Sign up for our bi-weekly newsletter and keep abreast of the latest market moving events!
Trade Smarter - Sign up for the DailyFX Newsletter
Receive timely and compelling market commentary from the DailyFX team
CANADIAN DOLLAR FUNDAMENTAL BACKDROP
The Canadian dollar has been steadily weakening against the USD over the last few weeks following on from some hawkish messaging from Fed Chair Jerome Powell as well as a significant drop in global crude oil prices. With crude oil now finding some support, and the potential for OPEC+ to announce an extension of their voluntary production cuts through to next year, the loonie may well appreciate against the greenback short-term.
That being said, the upcoming US CPI print will be crucial for Fed guidance and could prompt more hawkishness from Fed officials should inflation beat expectations.
USD/CAD ECONOMIC CALENDAR (GMT +02:00)
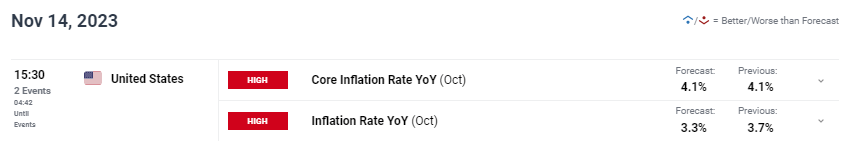
Source: DailyFX Economic Calendar
TECHNICAL ANALYSIS
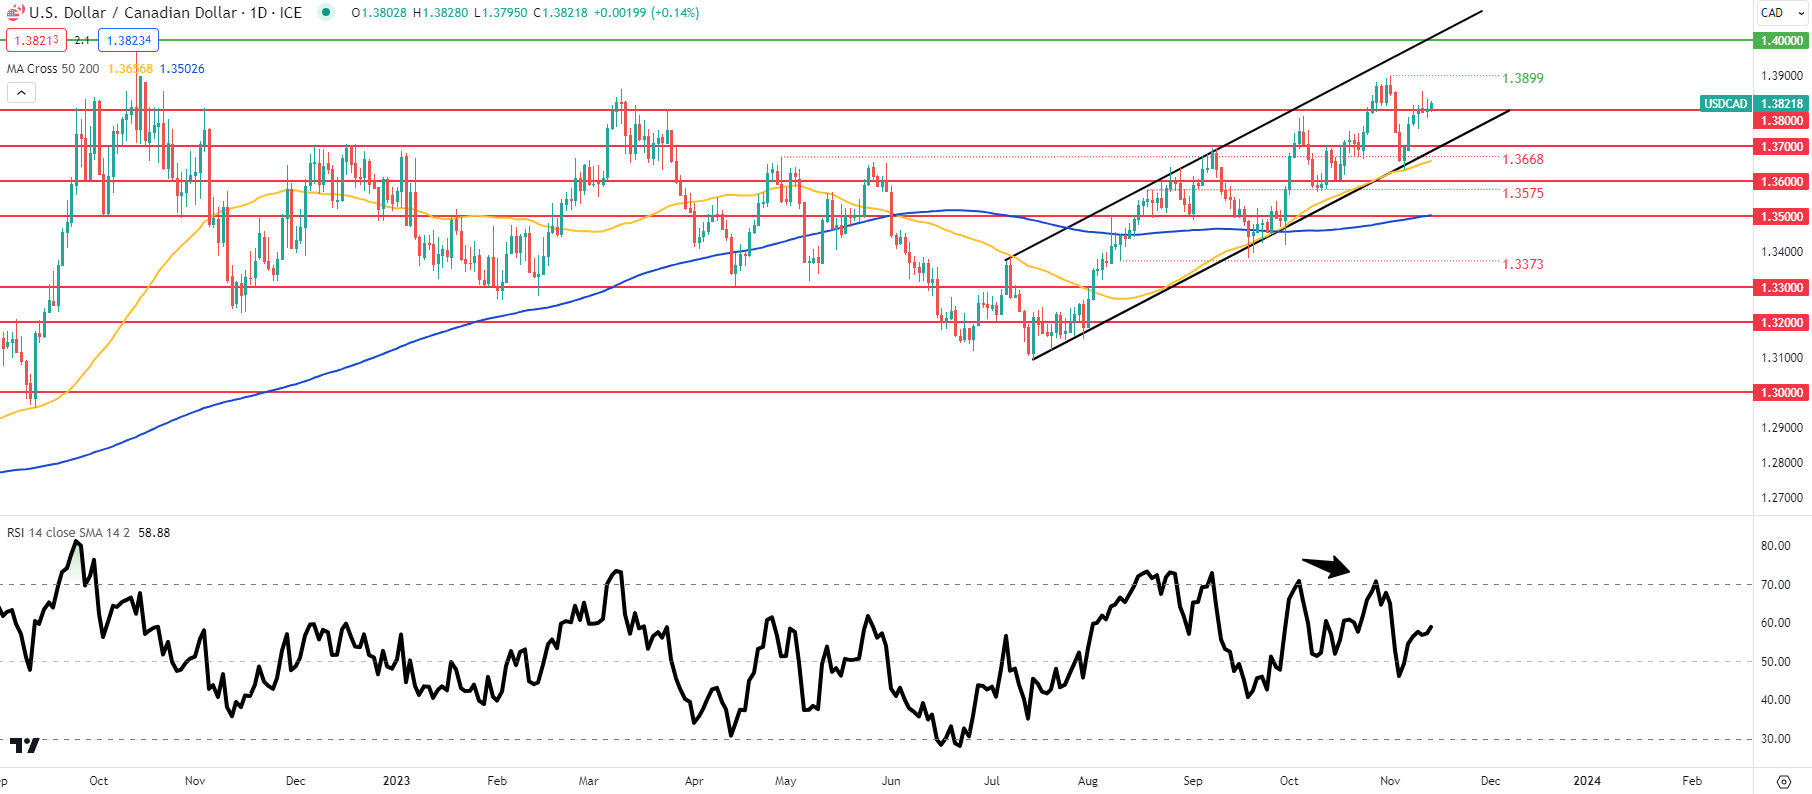
Chart prepared by Warren Venketas, IG
USD/CAD price action above shows the pair trading within the longer-term upward channel (black) while the Relative Strength Index (RSI) suggests bearish/negative divergence. The recent long upper wick candle may supplement this outlook and potentially see levels below 1.3800 once more.
Key resistance levels:
- 1.4000
- 1.3899
Key support levels:
- 1.3800
- 1.3700/Channel support
IG CLIENT SENTIMENT DATA: MIXED
IGCS shows retail traders are currently net SHORT on USD/CAD, with 72% of traders currently holding short positions (as of this writing).
Curious to learn how market positioning can affect asset prices? Our sentiment guide holds the insights—download it now!
Introduction to Technical Analysis
Market Sentiment
Recommended by Warren Venketas
Contact and followWarrenon Twitter:@WVenketas


