


GBP/USD - Prices, Charts, and Analysis
- GBP/USD rally aided by US dollar weakness.
- The previous UK government’s policy losses have been wiped out.

Most Read: GBP/USD Breakout Nears as Highs and Lows Compress
Sterling continues its multi-week rally, helped in part by a weaker US dollar, and cable has now erased all the losses bought about by the previous government’s tax-cutting policy errors. GBP/USD has rallied by nearly 18 big figures from its multi-decade low of 1.0350 and is back at levels last seen in mid-August.
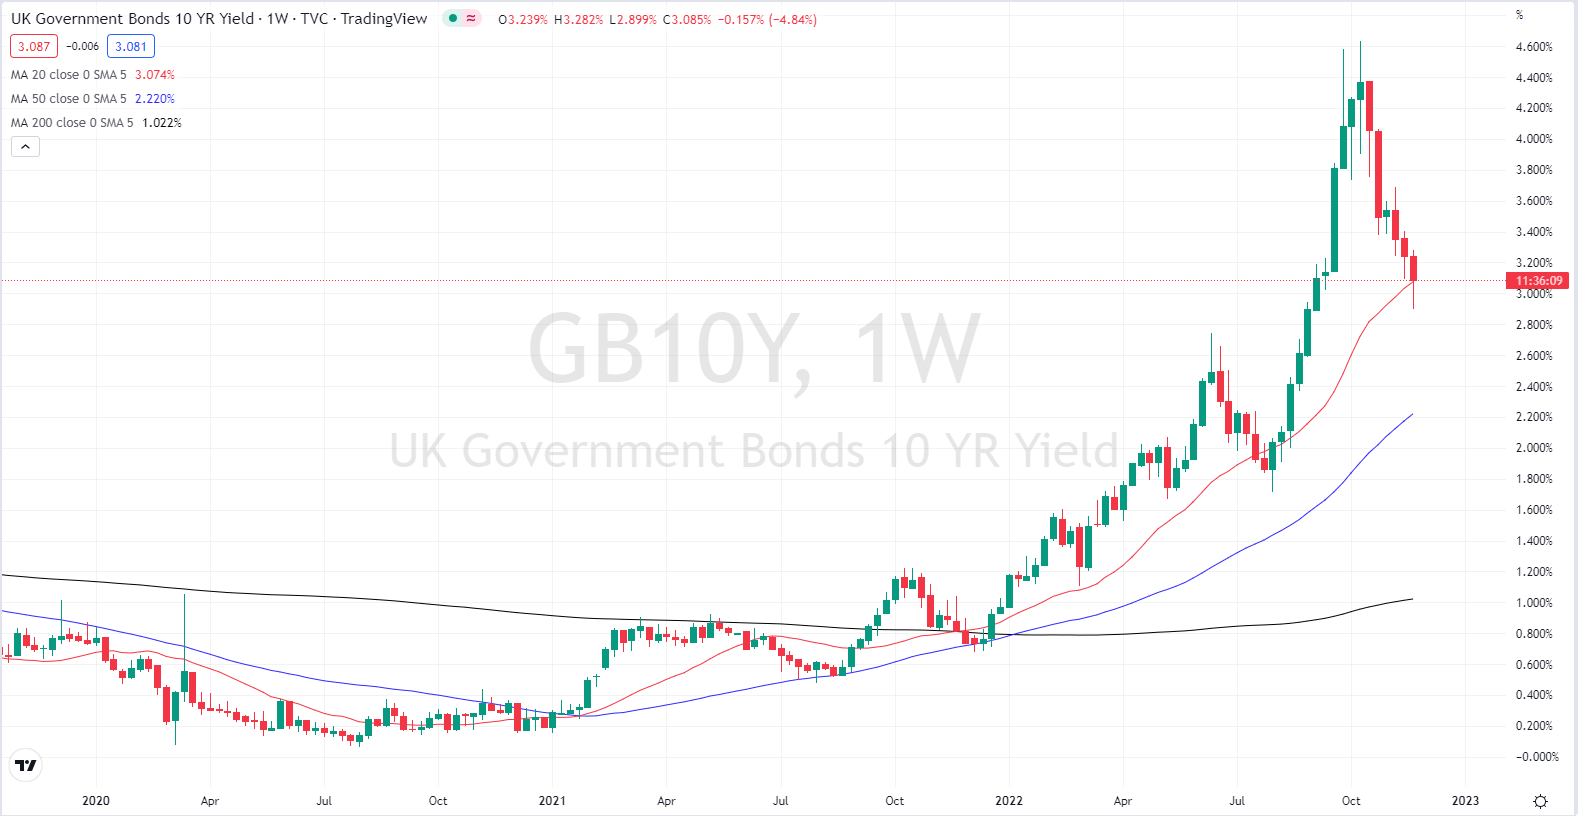
It is not just Sterling that has expunged ex-UK PM Liz Truss’s errors with the gilt market also rallying hard – yields falling – since the beginning of October, lowering the government’s borrowing costs sharply.
UK 10-Year Gilt Yields – Weekly Chart

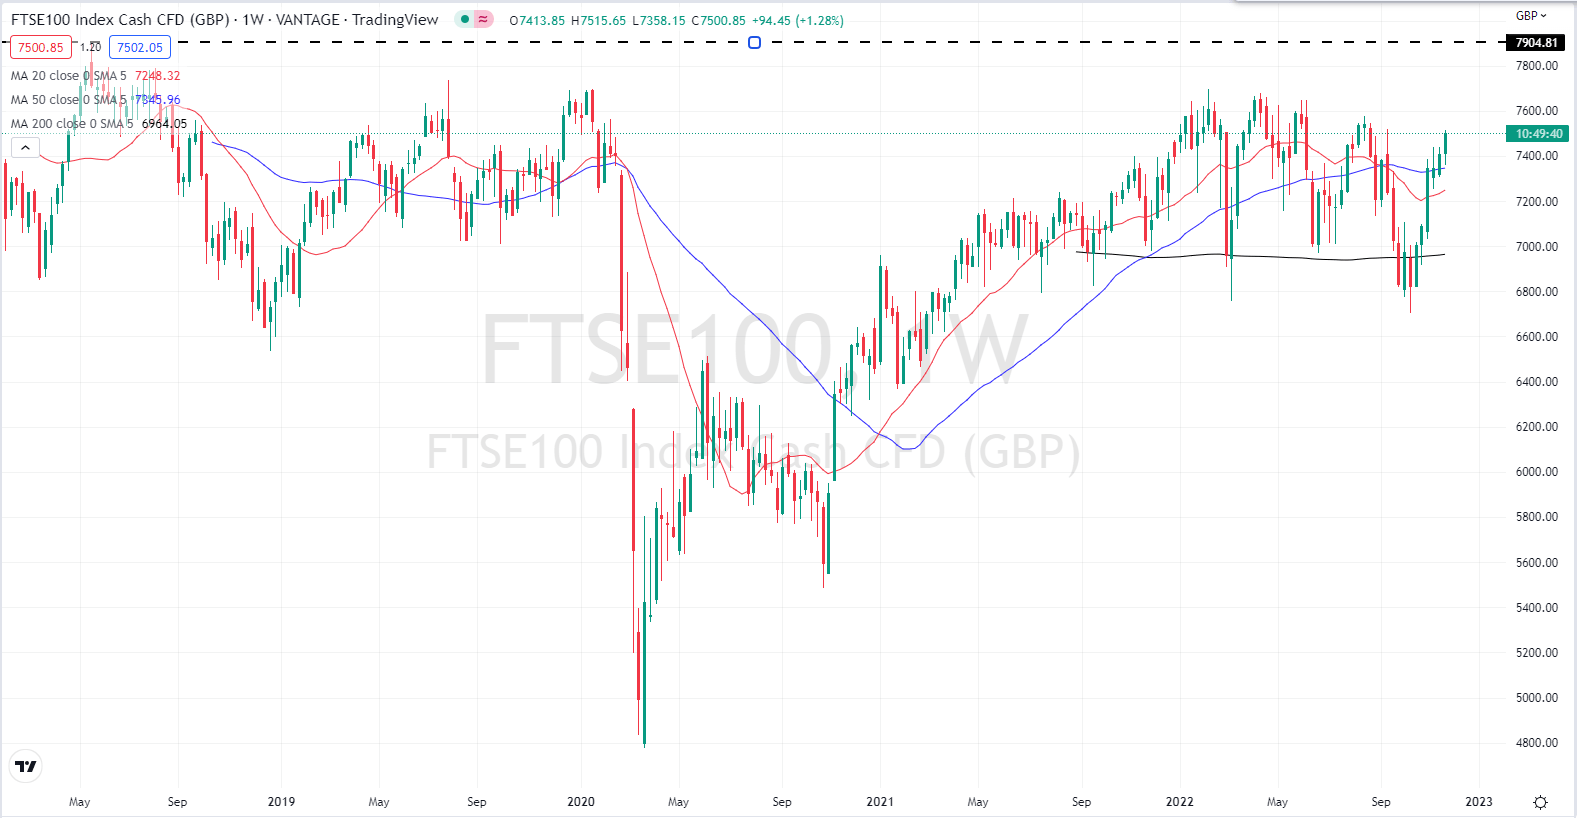
The UK FTSE 100 has also been in a buoyant mood over the last few weeks and is close to 800 hundred points higher than its mid-October nadir.
FTSE 100 - Weekly Chart
The week ahead has little in the way of market-moving economic data releases or events, leaving cable looking at the US dollar. The US economic docket has a handful of high-importance releases, including core PCE and NFPs, so cable may come back under the greenback’s influence again, in the short-term at least.
For all market-moving data releases and economic events see the DailyFX Calendar.
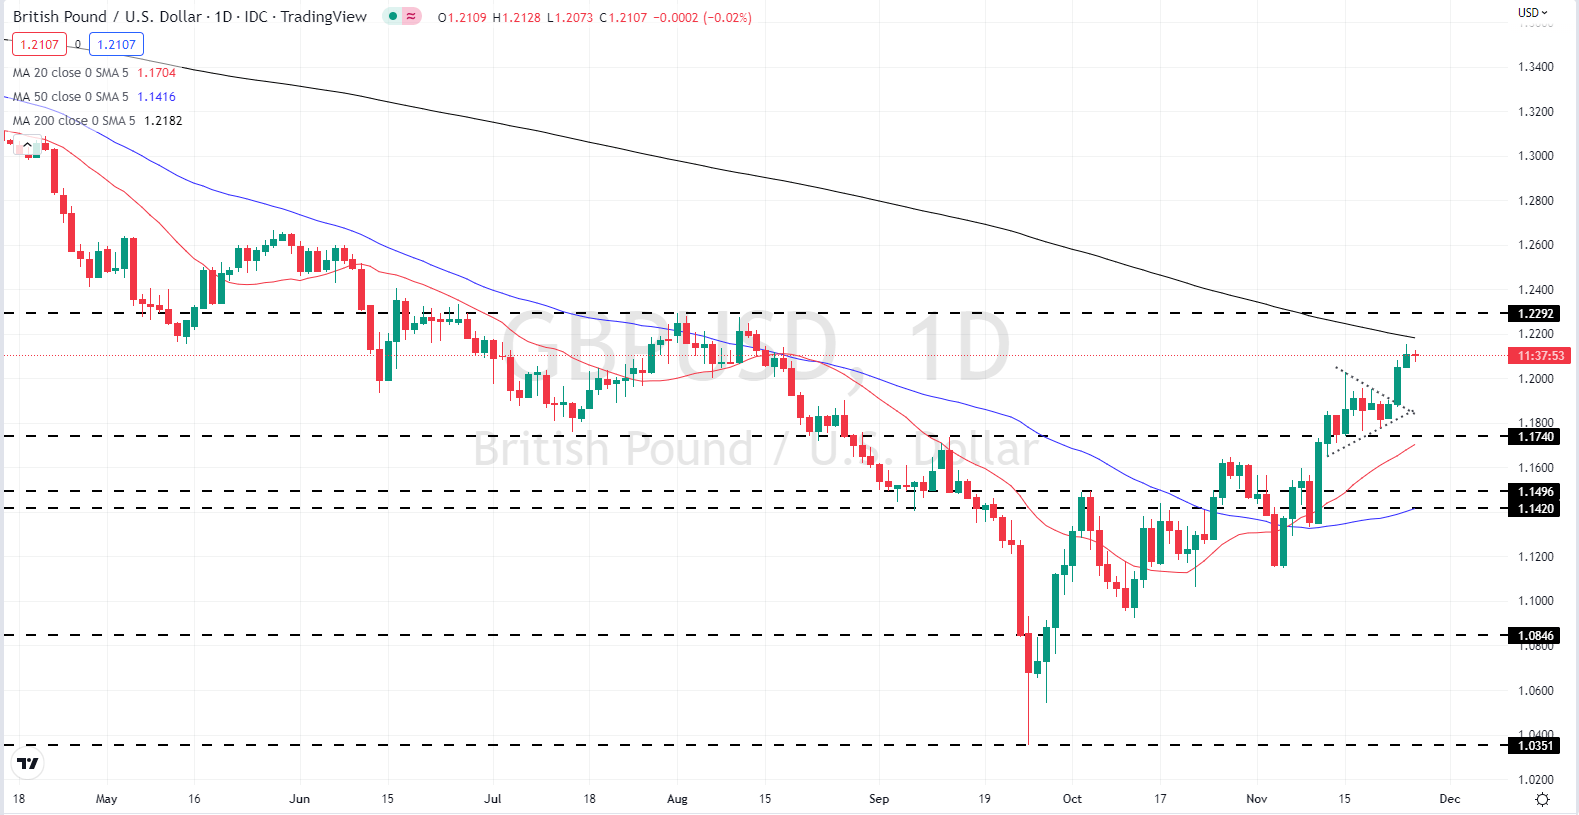
Cable’s move higher this week has seen it make a textbook break higher from a bullish pennant pattern, leaving GBP/USD very close to the longer-dated, 200-day moving average. If cable can make a confirmed break above this important technical indicator, then GBP/USD may well continue to push higher in the weeks ahead.
A Complete Guide to Using Moving Averages in Your Trading Strategy
GBP/USD Daily Price Chart – November 25, 2022
All Charts via TradingView
Retail Traders Increase their Weekly Net-Short Positions.
| Change in | Longs | Shorts | OI |
| Daily | -2% | 1% | 0% |
| Weekly | -28% | 40% | -8% |
Retail trader data show 38.05% of traders are net-long with the ratio of traders short to long at 1.63 to 1.The number of traders net-long is 6.23% higher than yesterday and 4.99% lower from last week, while the number of traders net-short is 2.68% higher than yesterday and 19.55% higher from last week.
We typically take a contrarian view to crowd sentiment, and the fact traders are net-short suggests GBP/USD prices may continue to rise. Positioning is less net-short than yesterday but more net-short from last week. The combination of current sentiment and recent changes gives us a further mixed GBP/USD trading bias.
What is your view on the British Pound – bullish or bearish?? You can let us know via the form at the end of this piece or you can contact the author via Twitter @nickcawley1.


