


Aussie Dollar, AUD/USD, AUD/NZD, CPI Update
- Aussie dollar posts massive inflation beat, shifting the focus to the RBA
- Australian CPI trends diverge from what we are seeing in other major economies
- AUD/USD pushes higher against the susceptible dollar and AUD/NZD breaks upside resistance with ease.
- The analysis in this article makes use of chart patterns and key support and resistance levels. For more information visit our comprehensive education library

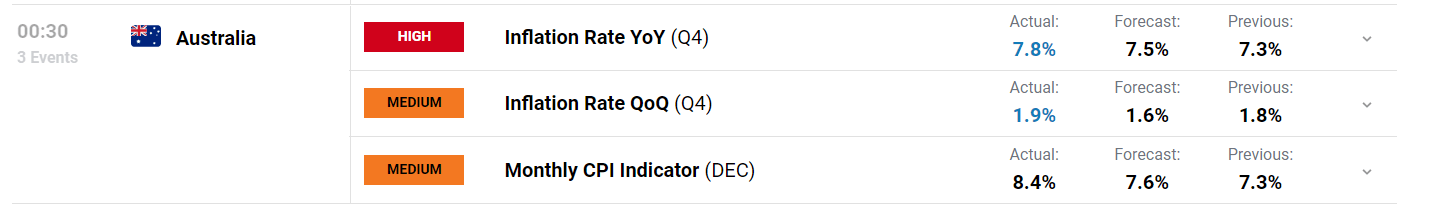
Australian Inflation Posts Massive Beat to the Upside
- CPI inflation rate (year on year): 7.8% vs 7.5% exp (7.3%prior)
- Trimmed-mean CPI (year on year): 6.9% vs 6.5% exp (6.1% previously)
Customize and filter live economic data via our DailyFX economic calendar
Australian headline inflation (CPI) continues to pick up, as does the preferred trimmed CPI, on both a month-on-month and year-on-year basis. The Reserve Bank of Australia (RBA) continues to hike interest rates and has decided to do so at a slower pace (increments of 25 basis points) since October of last year. However, it appears as if inflation is not following the trend seen in other prominent markets, mainly the United States.
The chart below reveals the stark difference in between Aussie and US inflation. US inflation (blue line) shows encouraging signs that headline inflation peaked last year while Australian CPI (yellow line) continues on its upward trajectory. The RBA will need to address these concerns in the upcoming meeting on February the 7th.
Australia is set to benefit from the Chinese reopening now that the Chinese government has stated that the nation has already reached a peak in infections and hospitalization rates. The reopening has resulted in increased purchases of Australia’s top export, iron ore, as prices have trended higher. While this is good news for the economy, the knock on effects this may have in regard to keeping inflation elevated will have to be monitored going forward.
Australian CPI Trends Compared to the United States
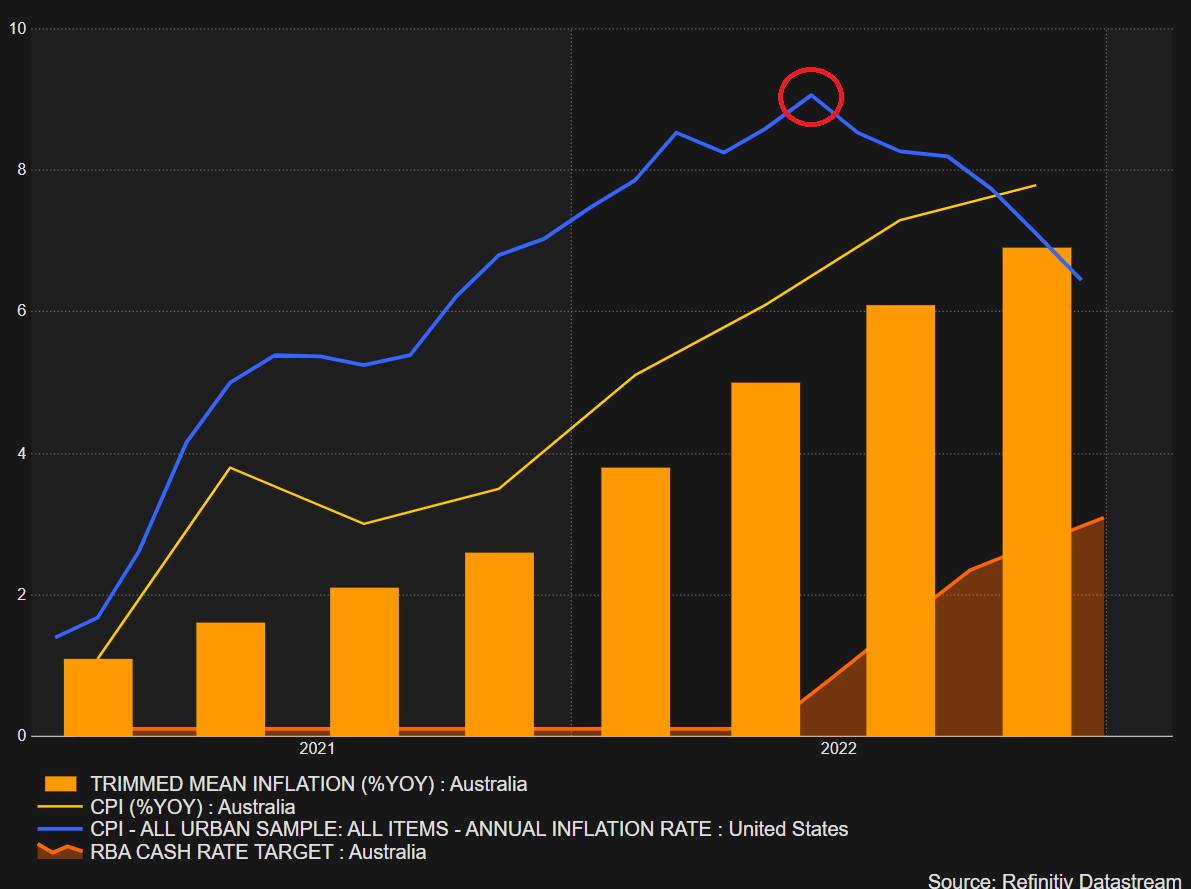
Source: Refinitiv, prepared by Richard Snow
Australian Dollar Technical Analysis
The AUD/USD pair has performed well during the early stages of 2023, helped in large part by the steady dollar downtrend and could possibly receive even further support if US GDP and US PCE data surprise to the upside on Thursday and Friday, respectively.
The pair trades to a 5-month high with the August 2022 swing high of 0.7137 very much in sight now, although, the RSI is nearing overbought territory which is something to monitor for a potential pullback. Support resides at 0.7063
AUD/USD Daily Chart
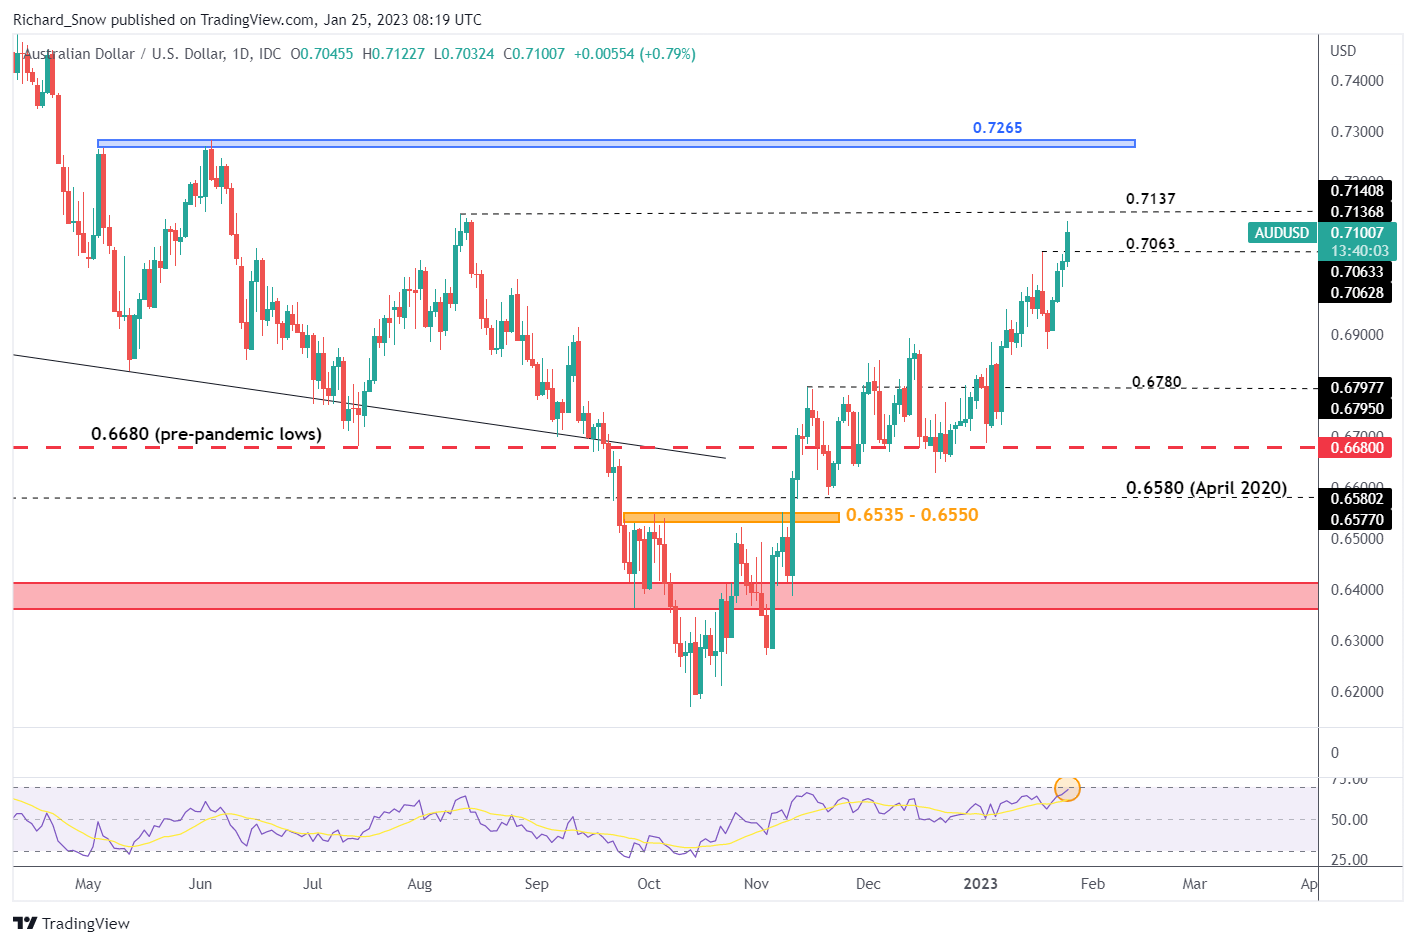
Source: TradingView, prepared by Richard Snow
New Zealand also witnessed an inflation beat, although not of the same magnitude as Australia, which draws the focus to AUD/NZD which has advanced above 1% at the time of writing. The advance rose above the November low of 1.0885 with relative ease and now tests the zone of resistance around 1.0960. The early signs of a rejection of higher prices (evidenced by the upper wick) suggest a pause before contemplating a bullish continuation. Support comes in at 1.0885 (prior resistance).
AUD/NZD Daily Chart
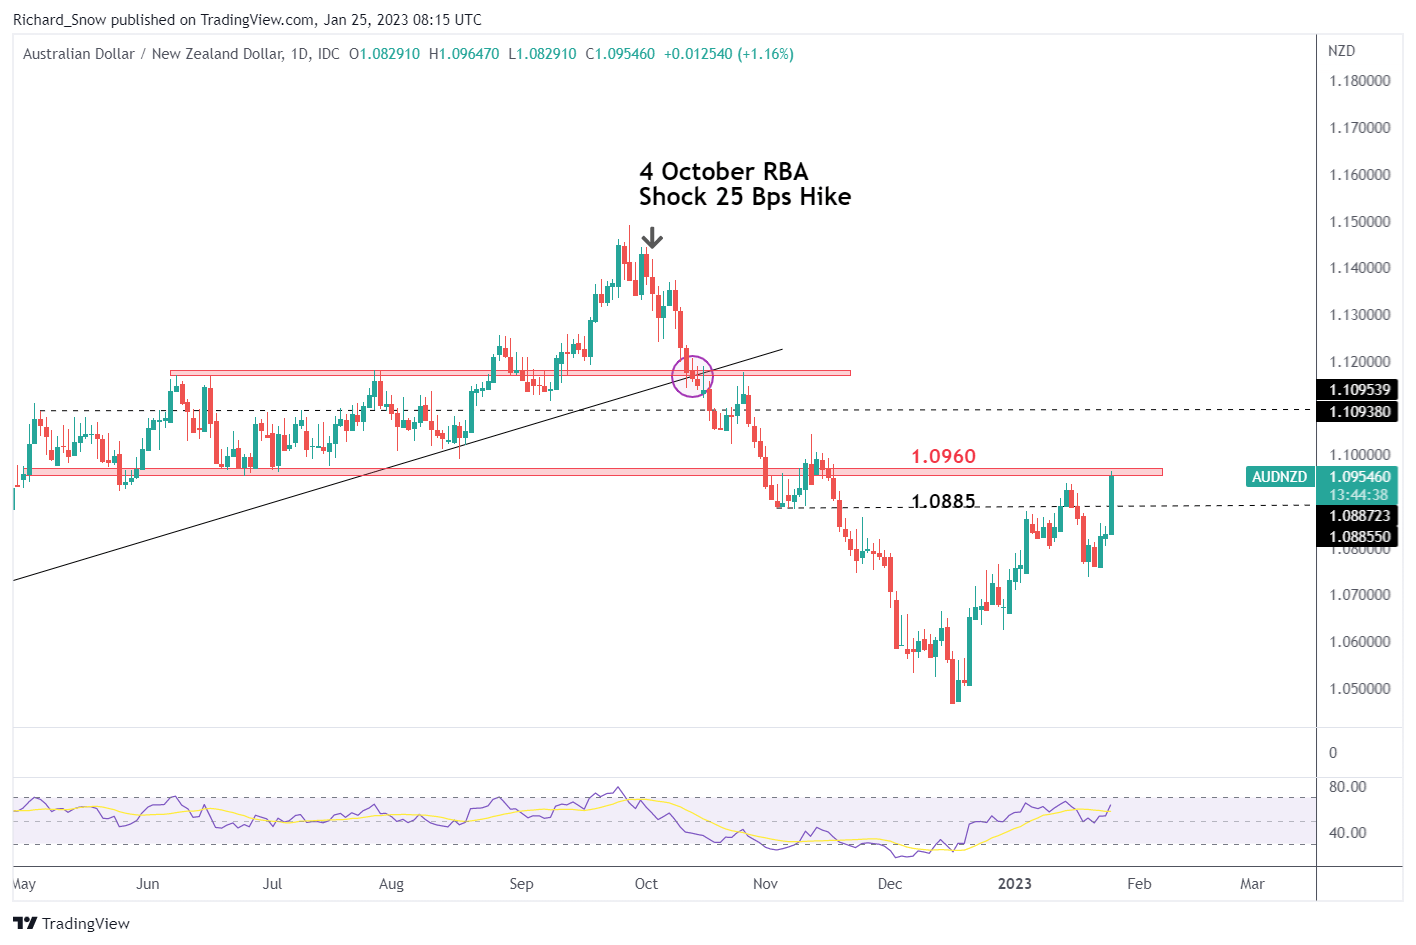
Source: TradingView, prepared by Richard Snow
--- Written by Richard Snow for DailyFX.com
Contact and follow Richard on Twitter: @RichardSnowFX


