


Although yesterday’s US inflation reading demonstrated that annual CPI dropped to 7.1% from 7.7% and Core CPI was 6% from 6.3%. This will not stop the Fed’s pushing for another rate hike which is yet to be announced today at 1900 GMT.
However, the US inflation print will definitively outline the tone of this evening. Should the news remain hawkish it probably would not have much impact on market compared to if we received a stronger CPI reading.
Taking a closer look at EUR/USD, although it is in within a bullish cycle from the lows of September 2022 at 0.95 all the way up to 1.06, there are many clues on the chart and fundamentals that shows EUR/USD may be running of steam.
EUR/USD Daily Timeframe – December 14th 2022
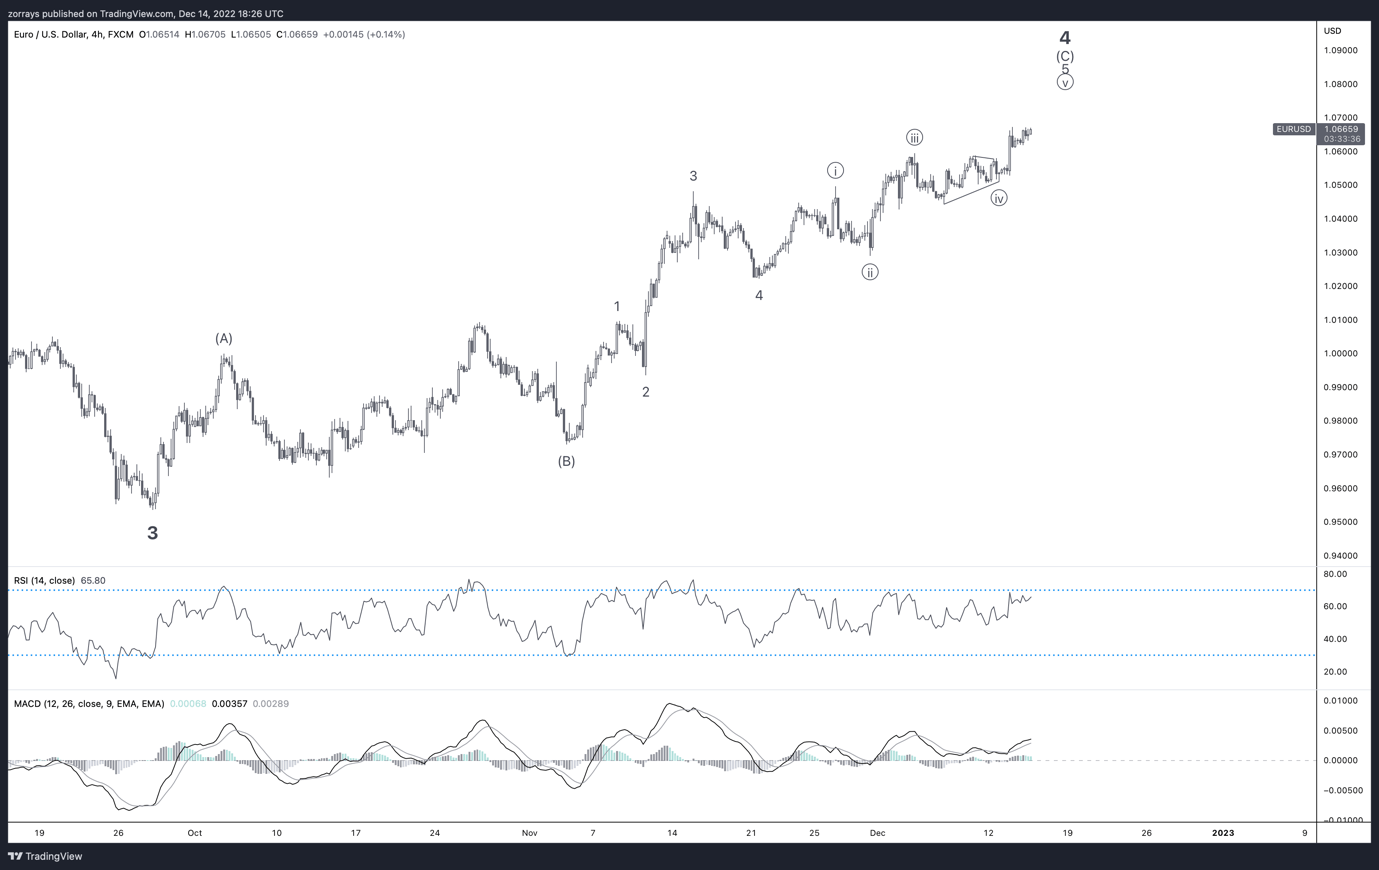
Chart prepared on TradingView by Zorrays Junaid
The chart is demonstrating a lot of clues itself. One of the main clues being that price is currently in wave (C) of wave 4. Wave C is the last wave within this corrective pattern, the Zig Zag. Also, within wave (C) EUR/USD is unfolding sub-wave ((v)). Therefore, the next move down would potentially be the start of wave 5 as wave 5 is the concluding move of an impulse wave.
On the 14-day RSI momentum indicator, we can see that there is bearish divergence. As price is forming new highs, the RSI is forming new lows. The same with the MACD indicator as it is also showing divergence.
At this point, a convincing key level to break would be 1.05 which would form a new lower low and break the structure of the bullish sequence and could shift the trend of EUR/USD.


