


With the new year comes new opportunities and certainly a new technical landscape for EUR/USD and many other FX pairs. This is due to markets transitioning from an extended period of aggressive rate rises and unrelenting inflation to one of optimism, anticipating lower inflation and the end of rate hikes.
As a result, the prevailing trends for most of 2022 are showing signs of reversal and EUR/USD is no different. The pair is on track to post three consecutive months of gains to close out 2022 – a year that witnessed euro weakness and dollar strength – a combination that plunged EUR/USD significantly lower throughout the first three quarters of the year. The counter-trend bullish momentum that unfolded in Q4 warrants a closer look as we head into Q1 of 2023.
EUR/USD Monthly Chart
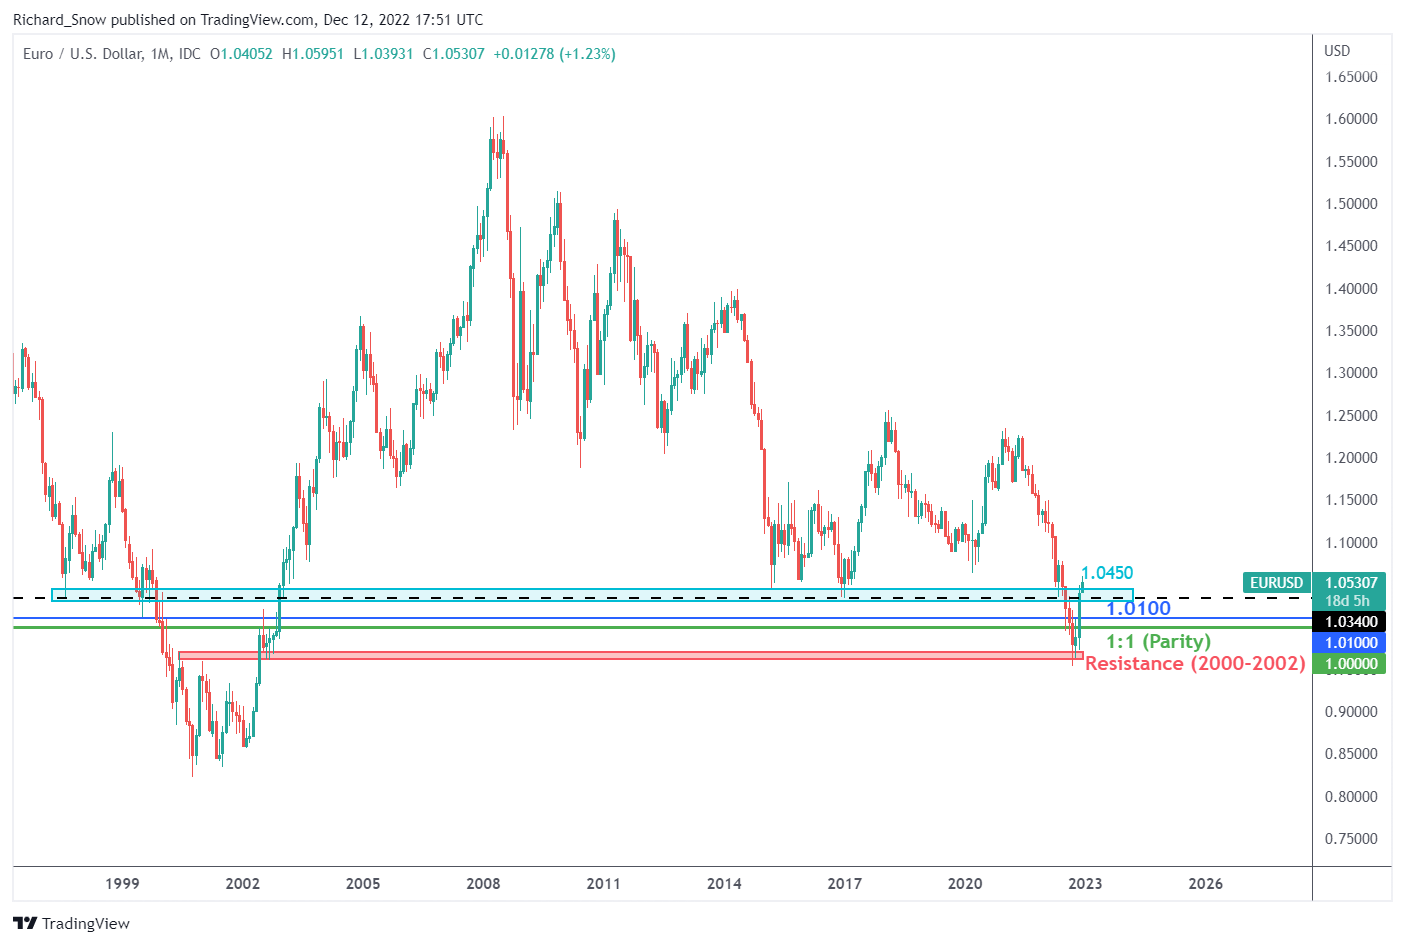
Source: TradingView, prepared by Richard Snow
EUR/USD Technical Forecast for Q1: Bullish
Zooming into the weekly chart, it’s clear to see the countertrend bounce off the zone of support (resistance between 2000 and 2002) between 0.9620 and 0.9700, which served as the launchpad for continued EUR/USD strength. The pair wasted little time trading above parity and 1.1000, two significant levels that had restricted the pair previously (more apparent on the daily chart).
The pair now trades above the large zone of resistance (1.0310 – 1.0450) and includes the 2017 low of 1.0340 - which previously acted as support and resistance. However, the pair appears to be showing the early signs of bullish fatigue around the 38.2% Fibonacci retracement of the major 2021 to 2022 move at 1.0610, as it had done in July of this year. The doji on the prior weekly candle would need to be kept in mind when observing the current week’s candle close (week 50) which has thus far hinted at a rejection of higher prices, trading lower off the 38.2% Fib level.
Therefore, the bullish outlook depends on a hold above the zone of support with renewed momentum to the upside. Thus far, the bullish counter-trend move has revealed shallow pullbacks – typically a sign of a promising advance.
EUR/USD Weekly Chart
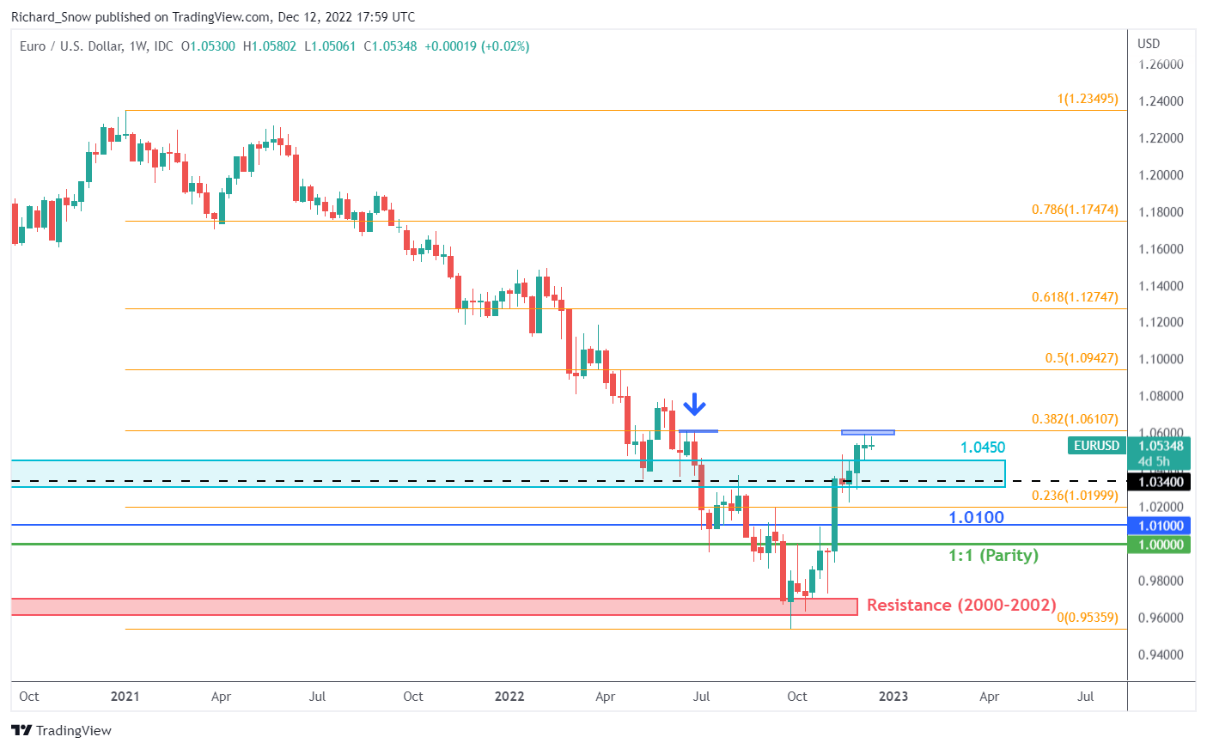
Source: TradingView, prepared by Richard Snow
The daily chart helps identify confluence support which, if significant enough, has the potential to reject an extended move lower. Price action trades above the 200 simple moving average (SMA) and above the zone of support, establishing higher highs and higher lows. It is against this backdrop that the technical landscape is one that remains supportive of EUR/USD towards 1.0800 with a view to extend to 1.0940 and possibly even the 61.8% Fib retracement at 1.1212. The invalidation level appears at 1.0200, a little below the November swing low.
EUR/USD Daily Chart
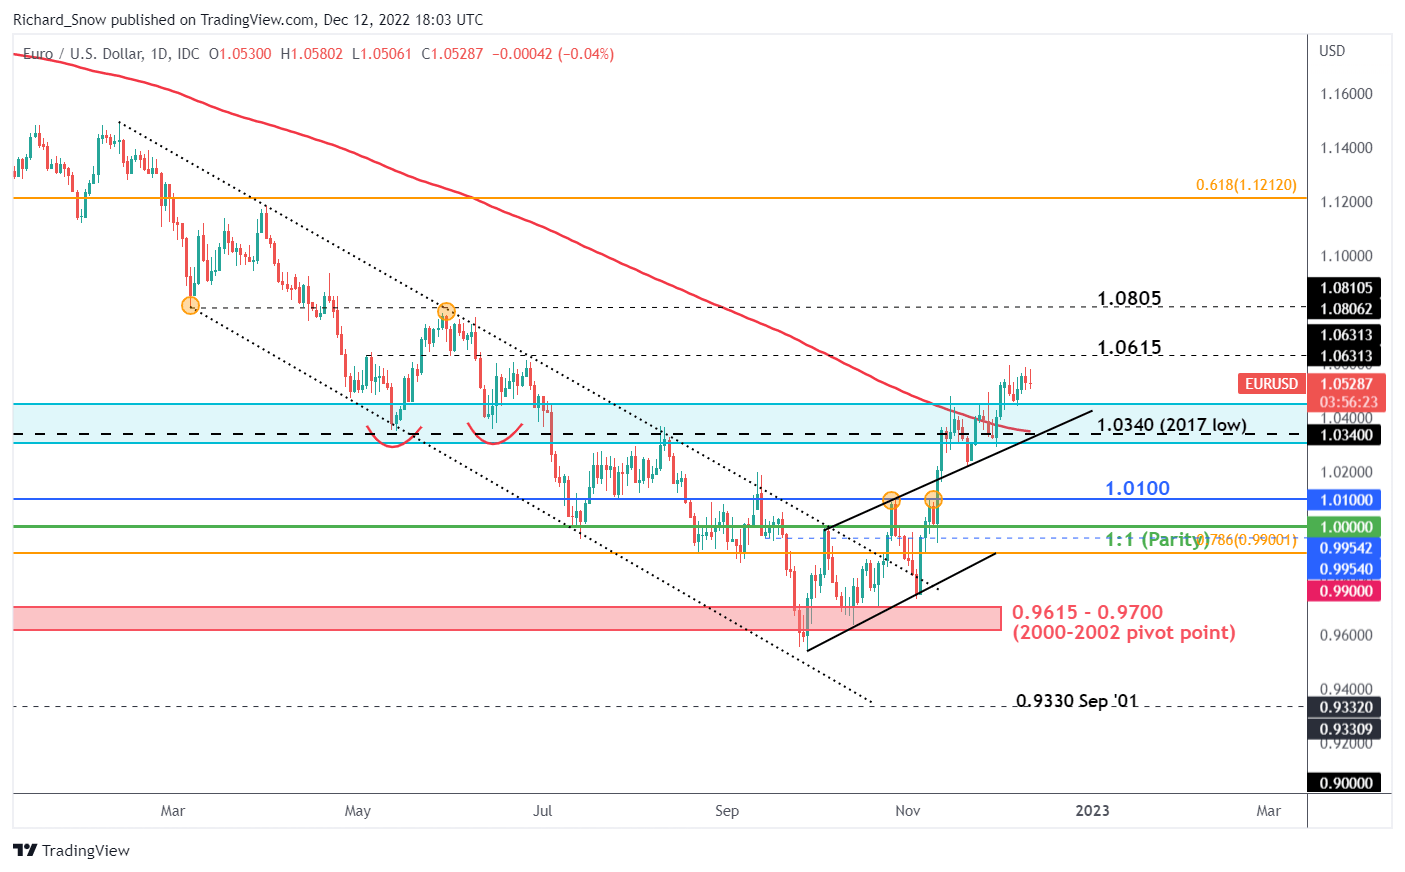
Source: TradingView, prepared by Richard Snow


