


US Dollar, Euro, EUR/USD, EUR/GBP, EUR/AUD – Outlook:
- EUR/USD is beginning to look a bit oversold within the short-term downtrend.
- EUR/GBP and EUR/AUD are looking heavy.
- What is the trend and the key levels to watch in key Euro crosses?

The euro is beginning to look a bit oversold at least against the US dollar ahead of key Euro area inflation data, opening the door for a minor rebound. However, the pace and the extent of the fall this month have raised the bar for a sustained move higher in the single currency.
Overbought conditions, stretched positioning, and hawkish repricing in US rates triggered a pause in the euro’s two-month rally against the US dollar. See “To What Extent Euro Could Fall? EUR/USD, EUR/GBP, EUR/JPY Price Setups”, published May 16.
Economic Surprise Index and FX Positioning
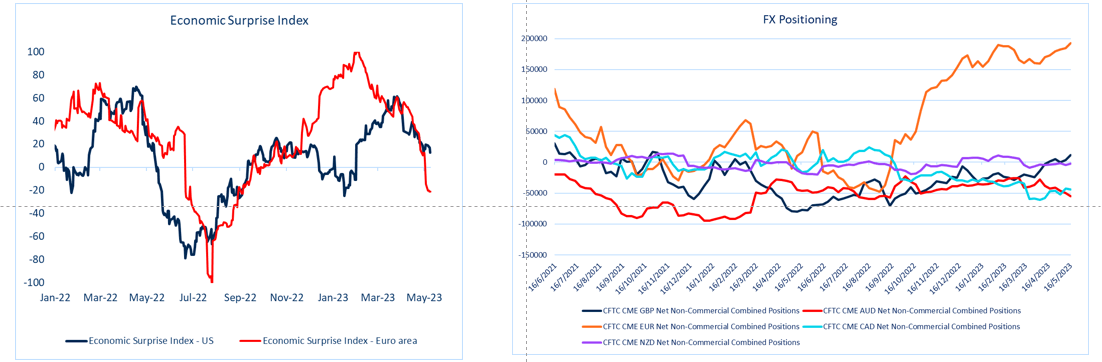
Source Data: Bloomberg; chart prepared in Microsoft Excel.
While overbought conditions have reversed, positioning remains unchanged. Despite the recent slide, long speculative EUR positioning is running around the highest since 2020 and within the major currency space (see chart), suggesting continued overcrowded conditions for the single currency.
EUR/USD Daily Chart
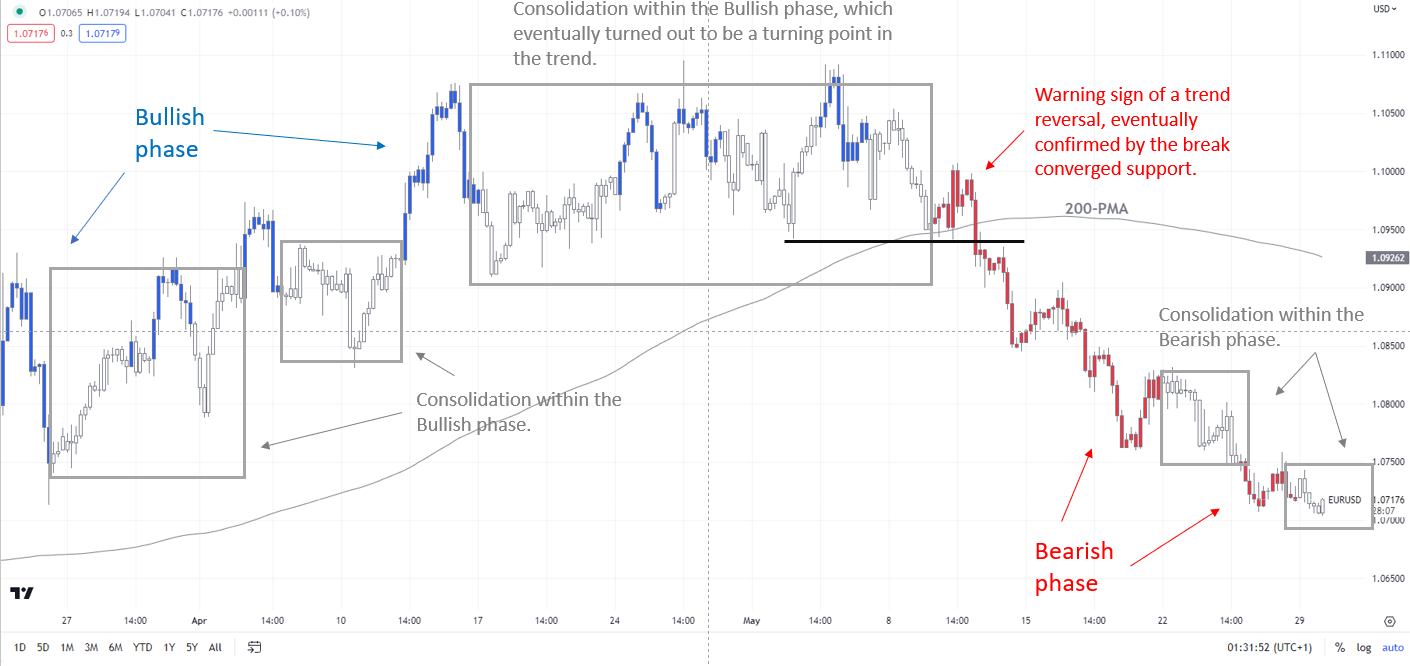
Chart Created by Manish Jaradi Using TradingView; Notes at the bottom of the page.
From a macro perspective, Euro area macro data have been underwhelming, further weighing on EUR. The Economic Surprise Index (ESI) for the Euro area continues to slide, even as the ESI for the US appears to have stabilized recently (see chart). Key focus is now on German inflation data due on Wednesday and Euro area figures on Thursday, and US jobs data on Friday.
EUR/USD Weekly Chart
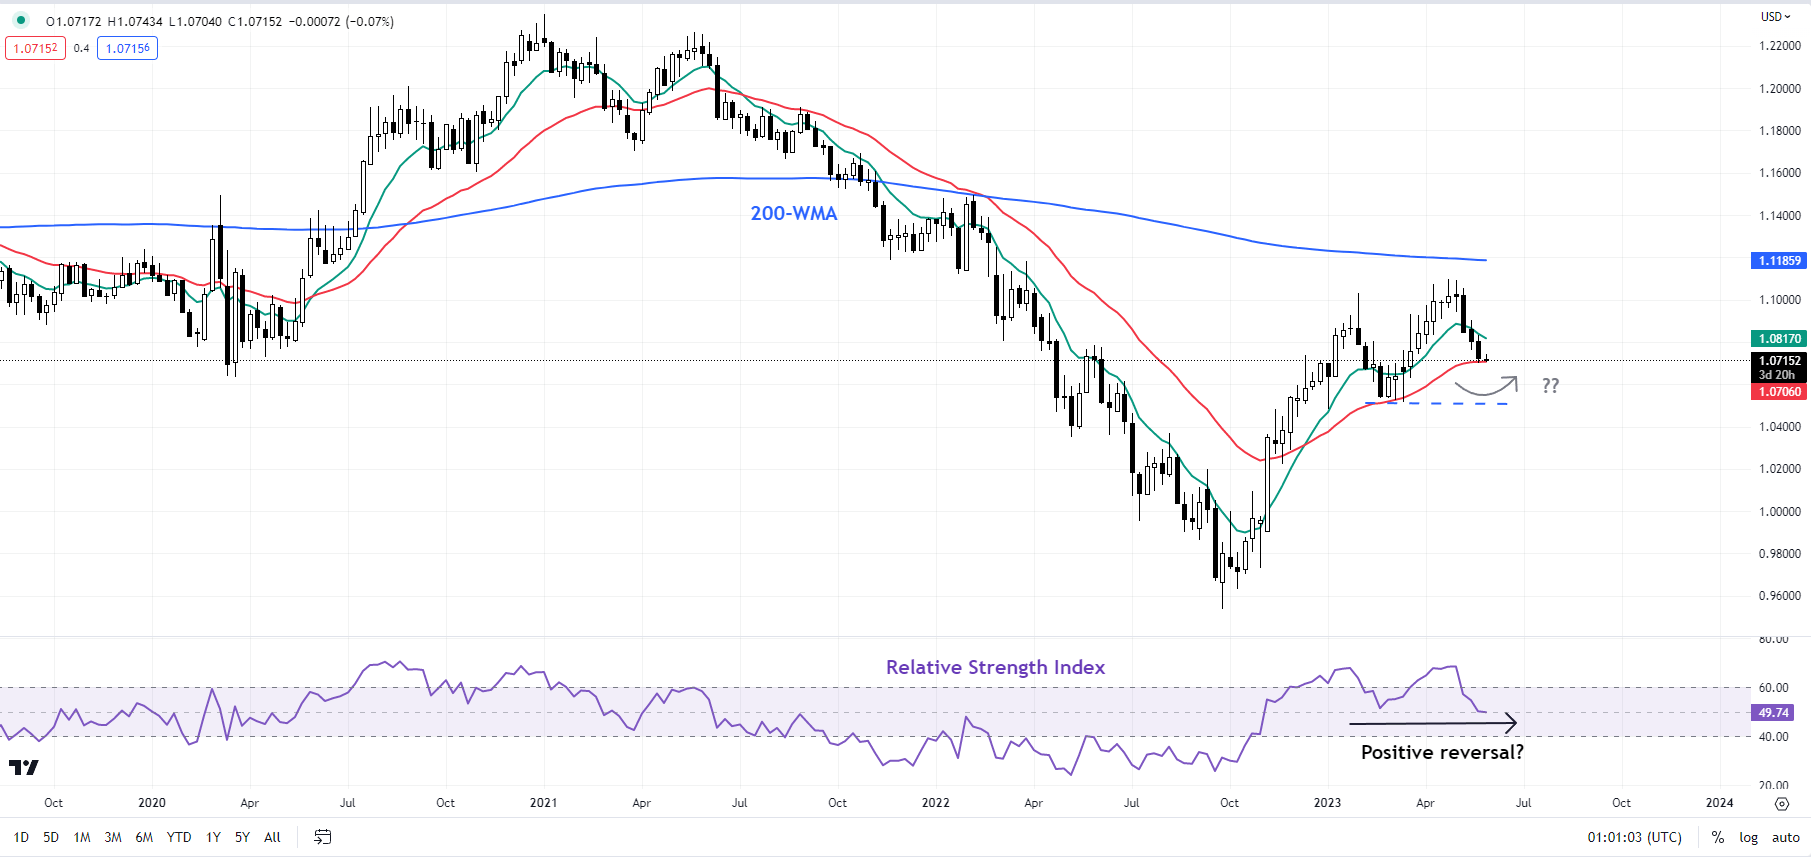
Chart Created by Manish Jaradi Using TradingView
Money markets are pricing in more than two rate hikes while pushing back a peak in rates to December. In this regard, Irish central bank chief Gabriel Makhlouf said last week that more than two ECB rate hikes this year are possible given stubborn inflation. In contrast, markets are pricing in a 63% chance of a 25 bps Fed rate hike at the June meeting up from 25% a week ago, according to the CME FedWatch tool.
EUR/USD Daily Chart
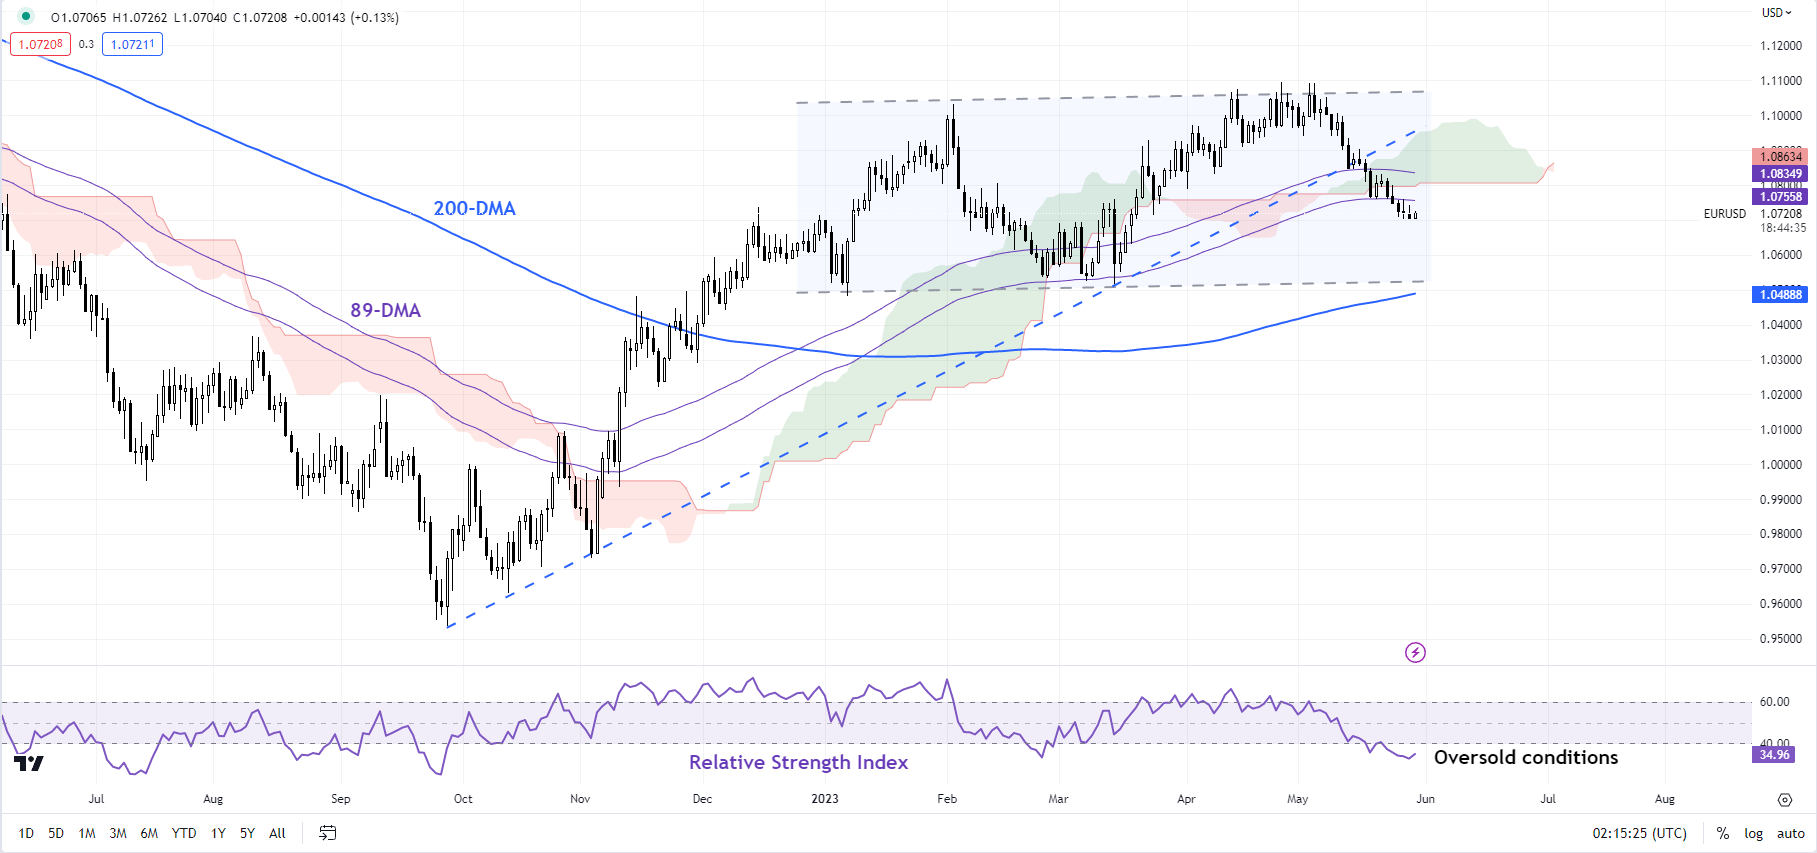
Chart Created by Manish Jaradi Using TradingView
EUR/USD: Short-term trend is down
As the colour-coded candlestick 240-minute charts show, based on trending/momentum indicators, EUR/USD is in a bearish phase. However, on the daily charts, EUR/USD has moved to a consolidation phase within the bullish structure that started in late 2022 - a risk highlighted in early May. See “Did ECB Just Put Brakes on Euro’s Rally? EUR/USD, EUR/AUD, EUR/JPY”, published May 5.
EUR/USD’s drop below the lower edge of the Ichimoku cloud on the daily chart is a signal that the upward pressure has faded slightly in the short term. A stronger cushion is at the March low of 1.0510, near the 200-day moving average, which could contain the current downtrend.On the upside, the mid-May high of 1.0900 could pose stiff resistance.
EUR/GBP Daily Chart
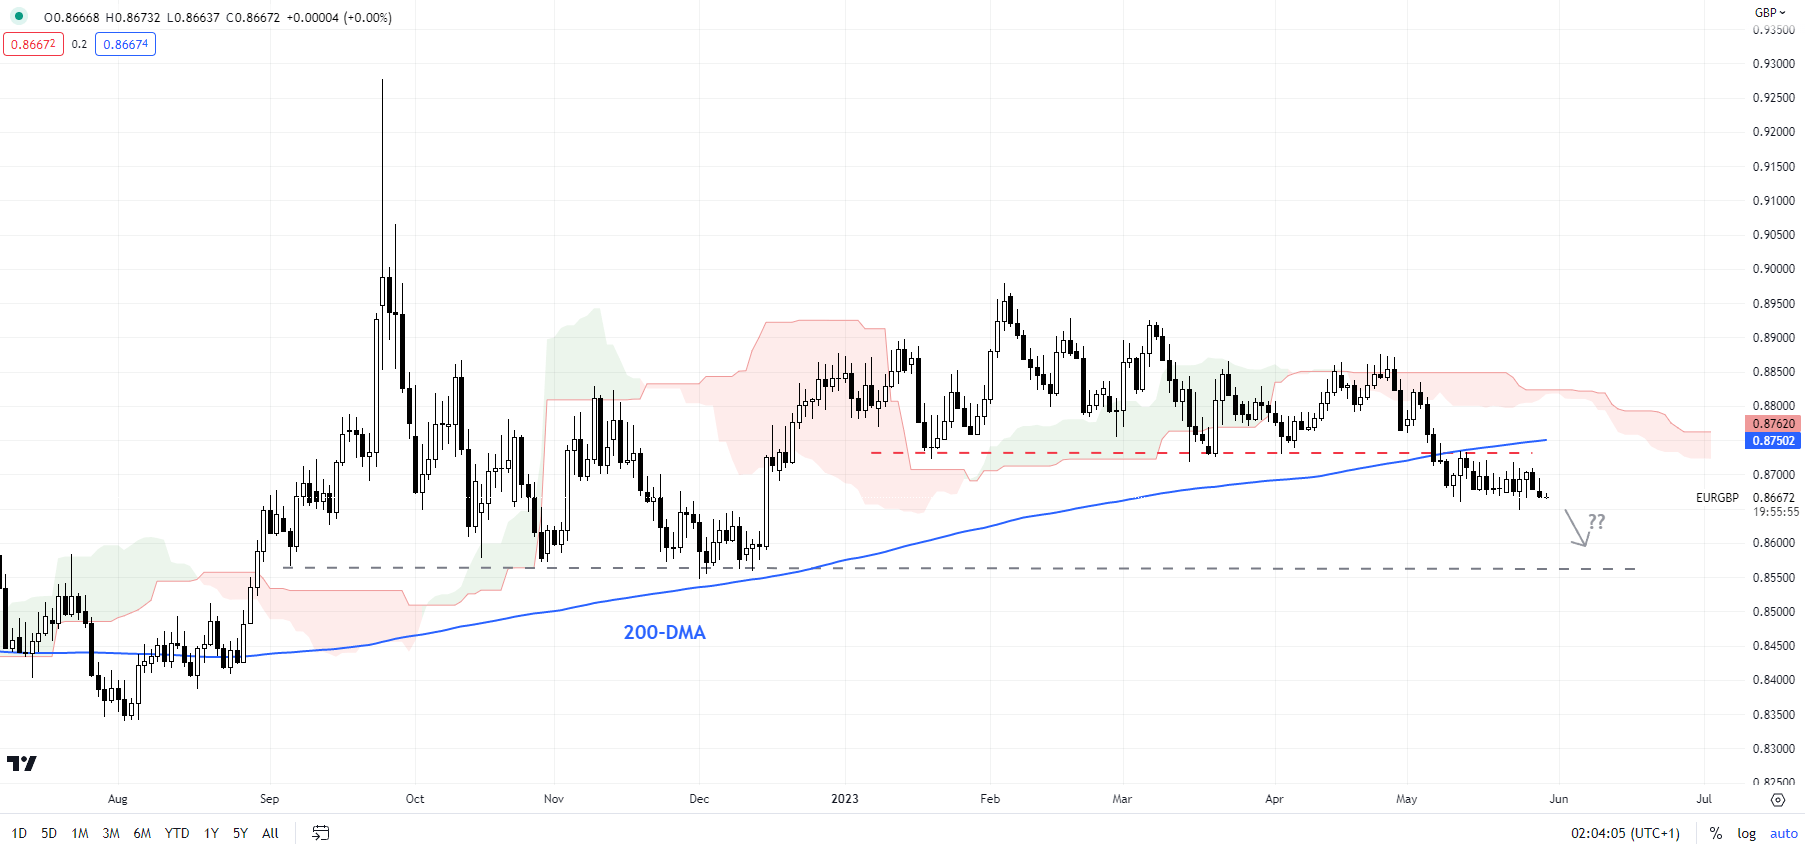
Chart Created by Manish Jaradi Using TradingView
EUR/GBP: Bias remains down
The stall in the downtrend could be a sign of delayed decline, rather than a reversal inEUR/GBP’s fortunes. The cross would need to rise above immediate resistance at 0.8750 for the bearishness to fade. Until then, the bias remains for a move toward the December low of 0.8545.
EUR/AUD Daily Chart
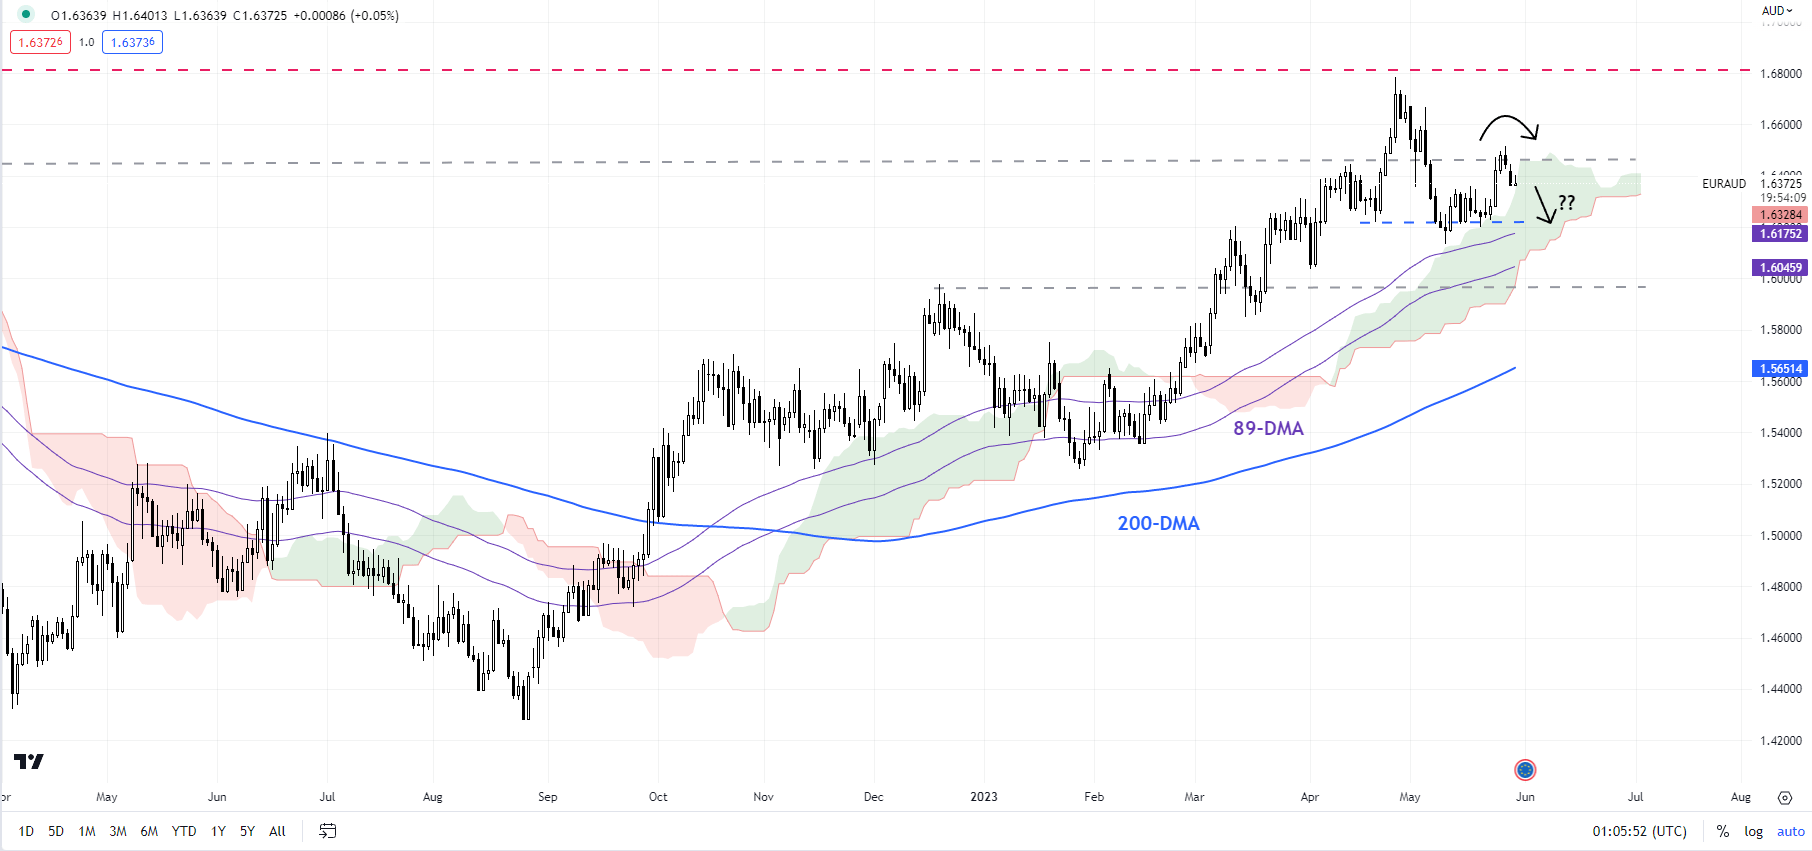
Chart Created by Manish Jaradi Using TradingView
EUR/AUD: Upside could be capped for now
EUR/AUD risks a retest of the 1.5950-1.6050 area (including the December high and the 89-day moving average). This follows a retreat last month from a tough barrier at the October 2020 high of 1.6825. For more discussion see “Australian Dollar Ahead of Budget: AUD/USD, AUD/JPY, EUR/AUD Price Setups”, published May 9.
Note: In the above colour-coded candlestick charts, Blue candles represent a Bullish phase. Red candles represent a Bearish phase. Grey candles serve as Consolidation phases (within a Bullish or a Bearish phase), but sometimes they tend to form at the end of a trend. Note: Candle colors are not predictive – they merely state what the current trend is. Indeed, the candle color can change in the next bar. False patterns can occur around the 200-period moving average, or around a support/resistance and/or in sideways/choppy market. The author does not guarantee the accuracy of the information. Past performance is not indicative of future performance. Users of the information do so at their own risk.

--- Written by Manish Jaradi, Strategist for DailyFX.com
--- Contact and follow Jaradi on Twitter: @JaradiManish


