Article by IG Chief Market Analyst Chris Beauchamp
Dow Jones, Nasdaq 100, Nikkei 225 Analysis, Prices, and Charts
Dow back above 34,000
The index has surged to the 34,000 level once more, and sits just below its previous June high.The bounce from the 50-day SMA has created a higher low, and further upside seems likely while this remains in place. Above 34,500 the next target would be 35,000.
A drop back below 33,640 would be needed to suggest that a new leg lower is in play.
Dow Jones Daily Price Chart


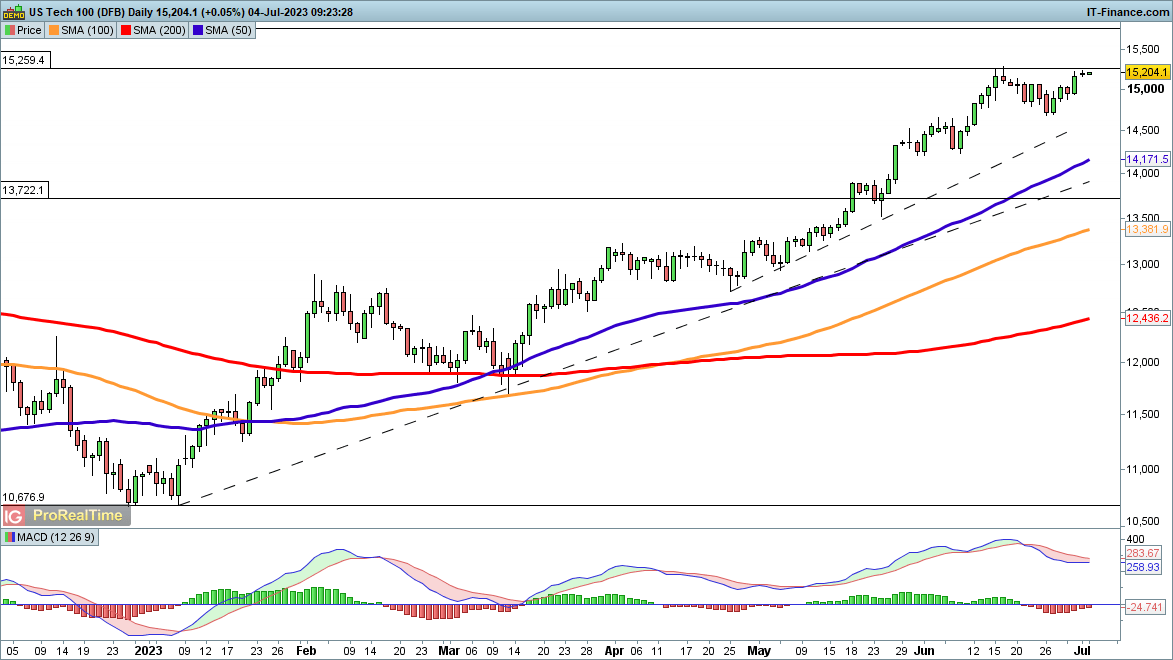
Nasdaq 100 is still firmly in an uptrend
As with the Dow, the index has returned to the highs seen in early June. The uptrend has recovered from the weakness of mid-June, and now a push above 15,260 will open the way to 15,760, and on from there towards 16,630, the record high of 2021.
The price remains overstretched, but the recent recovery has canceled out any bearish view in the short term. A reversal back below 14,700 would be needed to suggest fresh short-term weakness has appeared.
Nasdaq 100 Daily Price Chart
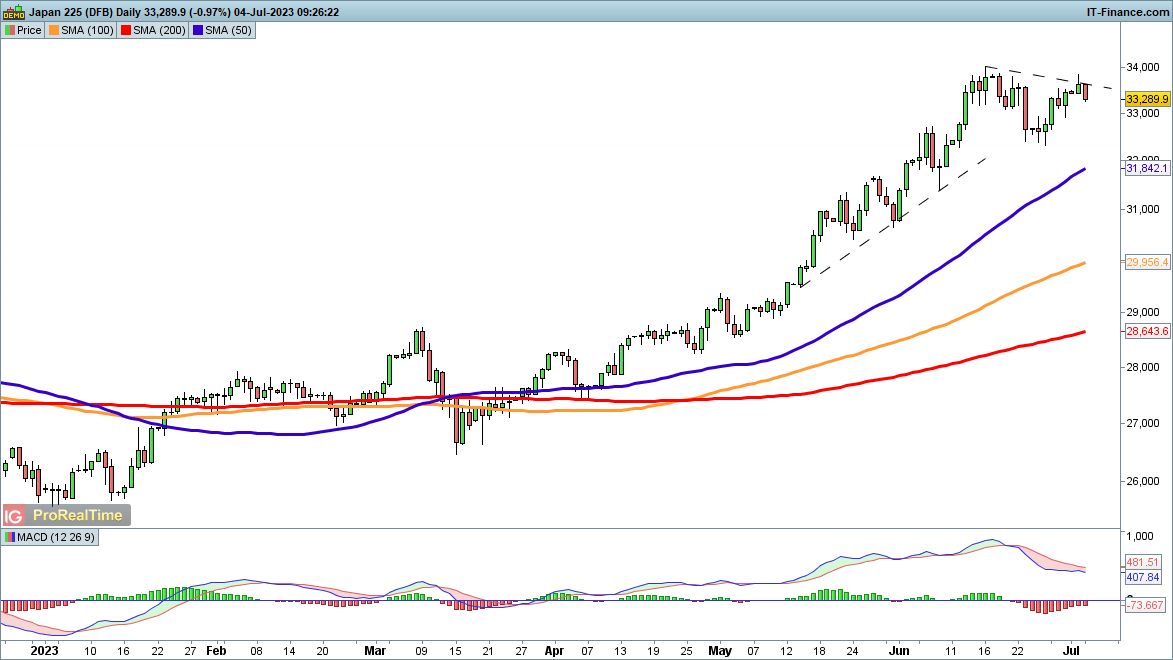
Nikkei 225 edges lower
The index has fallen back this morning, as markets continue to look nervously for any signs of intervention in the FX market by the Ministry of Finance, something that is unlikely to leave the index unaffected.Recent weakness stabilized around 32,500, so a move below this would be needed to open the way to more downside. This might then bring the 50-day SMA into play.
A revival above 33,700 would put the price on an upward footing once more, and suggest a move back to 34,000.
Nikkei 225 Daily Price Chart