Article by IG Chief Market Analyst Chris Beauchamp
Dow Jones, Nasdaq 100, Nikkei 225 Analysis and Charts
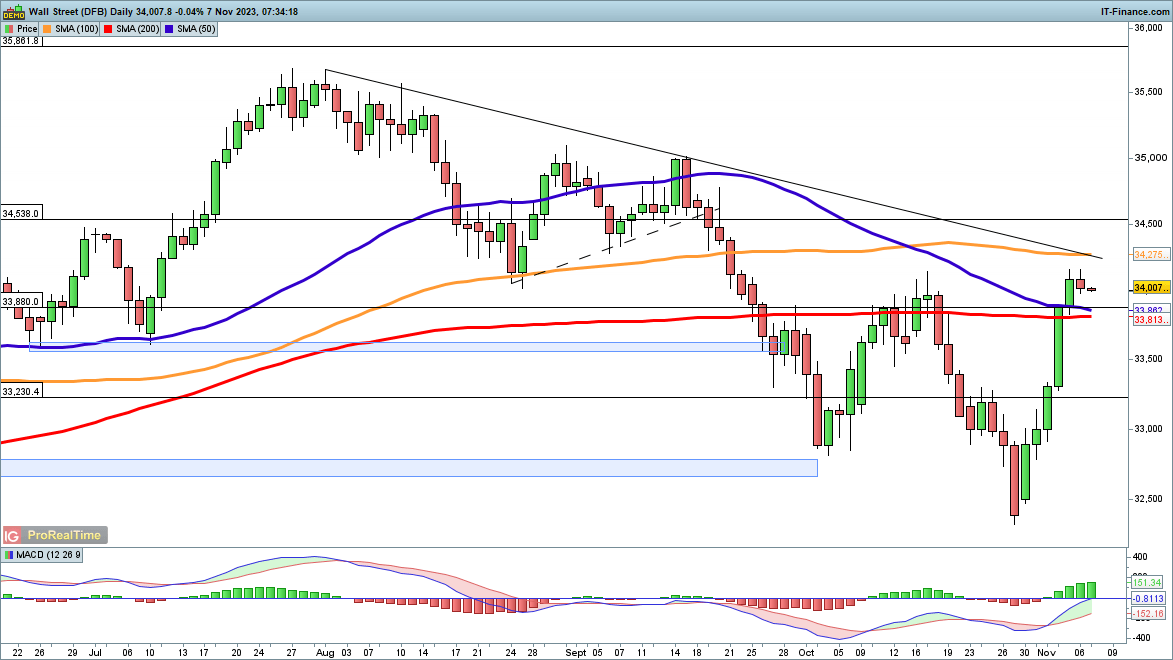
Dow steady around 34,000
The index saw its huge rally stall on Monday, perhaps unsurprisingly given the gains made last week and the lack of data during the session. The price finds itself above the 50- and 200-day simple moving averages (SMA), and sits right at the highs from early October. Trendline resistance from the July peak is the next area to watch, along with the 100-day SMA.
A reversal below the 200-day SMA might indicate some short-term consolidation.
Dow Jones Daily Chart
See How IG Client Sentiment Can Help You When Trading
| Change in | Longs | Shorts | OI |
| Daily | 27% | 4% | 10% |
| Weekly | -26% | 14% | -1% |
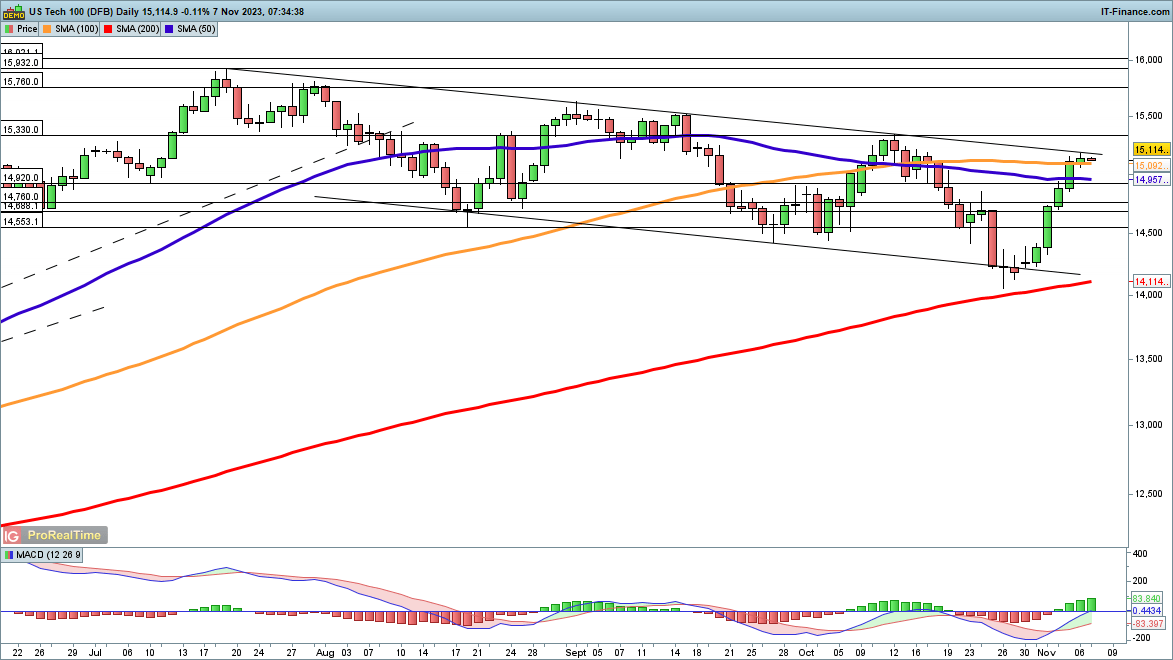
Nasdaq 100 sits below trendline resistance
The price has returned to the upper bound of the current descending channel, after its best week since January.In the short-term, the price will target the October highs at 15,330, and then on towards 15,540, the highs of late August and early September.
A close back below 14,920 would bring a bearish view into play once again.
Nasdaq 100 Daily Chart

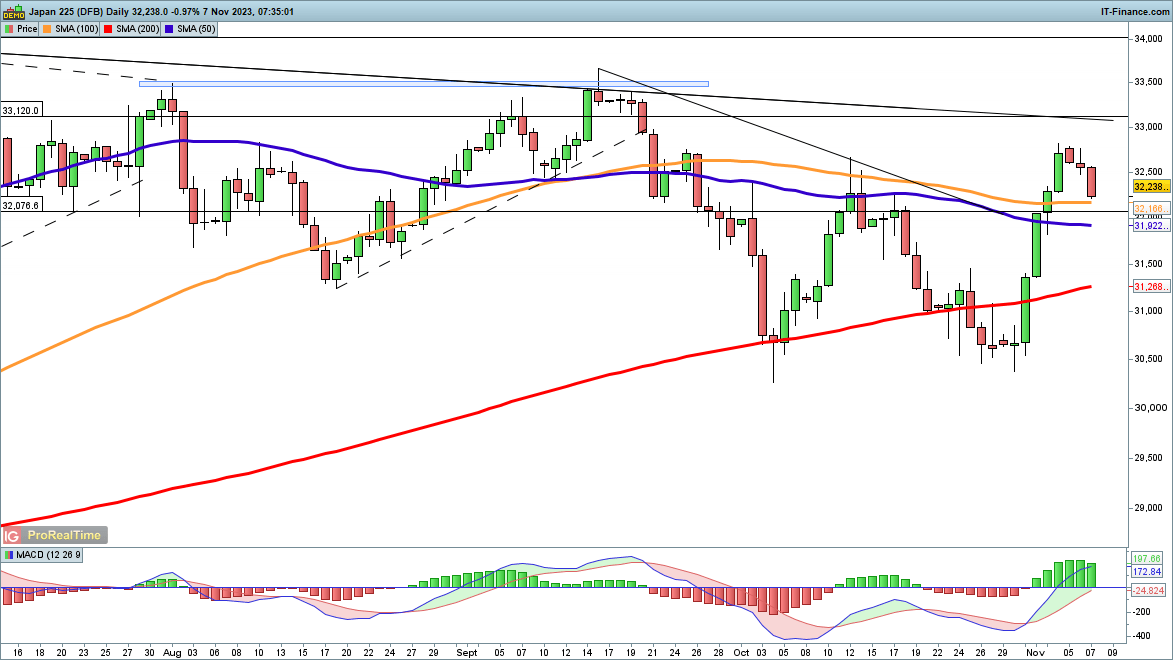
Nikkei 225 pulls back towards 100-day MA
Like other indices, the Nikkei enjoyed an impressive rally last week, moving higher off the 30,500 zone. Further upside now targets trendline resistance from the June high, which may come into play near 33,000. Beyond this, the September highs at 33,500 are the next target.
Sellers will need a move back below 32,000 to suggest a more serious pullback has developed, which would then target the 200-day SMA and the October lows around 30,500.
Nikkei 225 Daily Chart