Dow Jones, Nasdaq 100, Hang Seng Analysis and Charts
Dow retreats from record highs
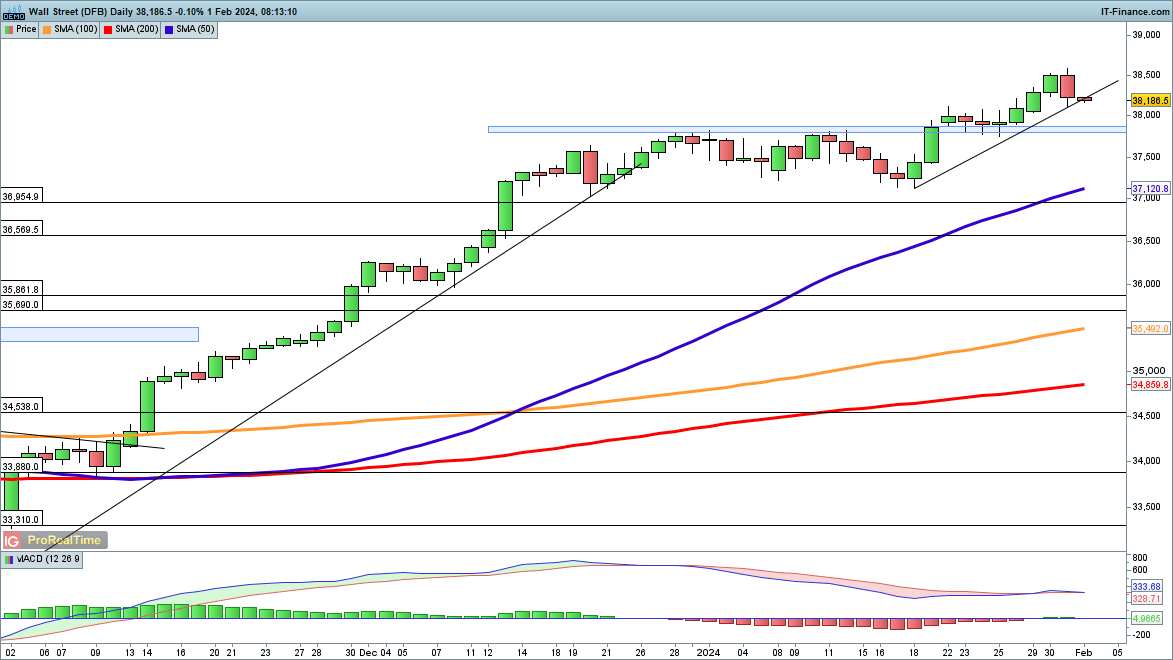
The index has fallen back from all-time highs and is currently testing trendline support from the mid-January low.In the short term, a break of support could test the area around 37,840, which was the late December high. Below this comes the 37,100 area that marked the low at the beginning of January.
A close back above 38,500 would put the price on course to hit new record highs.
DowJones Daily Chart
| Change in | Longs | Shorts | OI |
| Daily | -19% | 13% | -3% |
| Weekly | 14% | -16% | -6% |
Nasdaq 100 drops following Fed decision
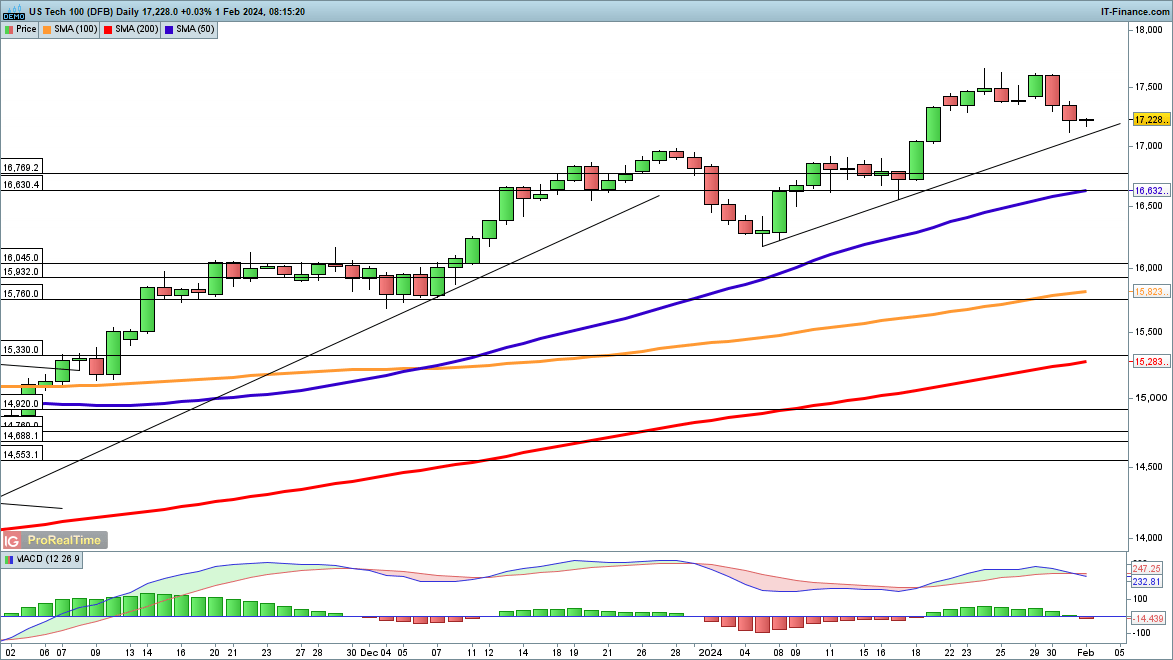
Further weakness in the wake of the Fed decision comes following losses earlier in the week after Alphabet and Microsoft earnings.Trendline support from early January comes into play around 17,150, and a break of this would then target the 16,630 area, which formed support in mid-January. The 50-day simple moving average (SMA) could also form support once more.
A rebound above 17,400 puts the price on course to target the previous highs.
Nasdaq100 Daily Chart

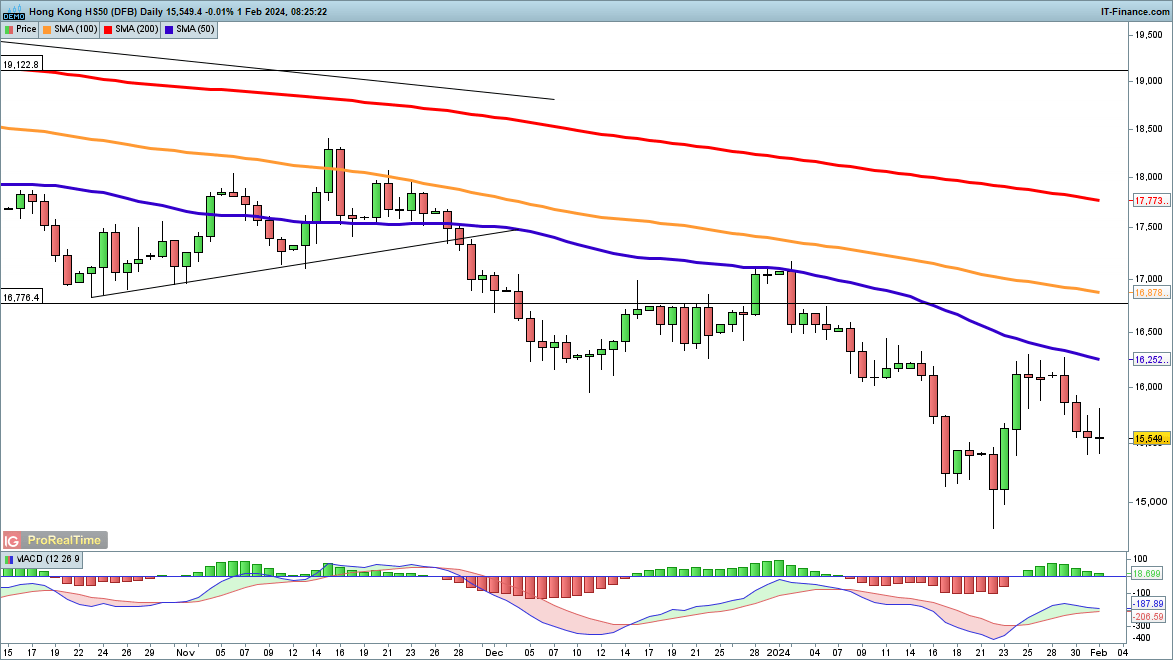
Hang Seng heads lower
Despite various new items around state support for the stock market, and a recent cut to bank reserve ratios, the Hang Seng continues to head lower.The most recent rebound carried the price back above 16,000, but then it has faltered below the 50-day SMA. Continued losses now target the late January low at 14,778. Below this lies the 14,581 low of October 2022.
A short-term rebound could target 16,000 once more, and then towards the 16,300 zone that marked resistance last week and earlier in January.
Hang Seng Daily Chart